Onshore wind
Onshore wind
Table of Contents
General
Onshore wind turbines are smaller than offshore wind turbines, typically no more than 3 MW, compared with up to 16 MW for the largest announced Goldwind offshore wind turbine. Onshore wind farms also tend to have a lower capacity factor (average / maximum output over a period), such as 25-30%, compared with offshore wind farms – some offshore wind farms are expected to have a 60% capacity factor. Onshore wind turbines heights can be subject to planning regulation height restrictions.
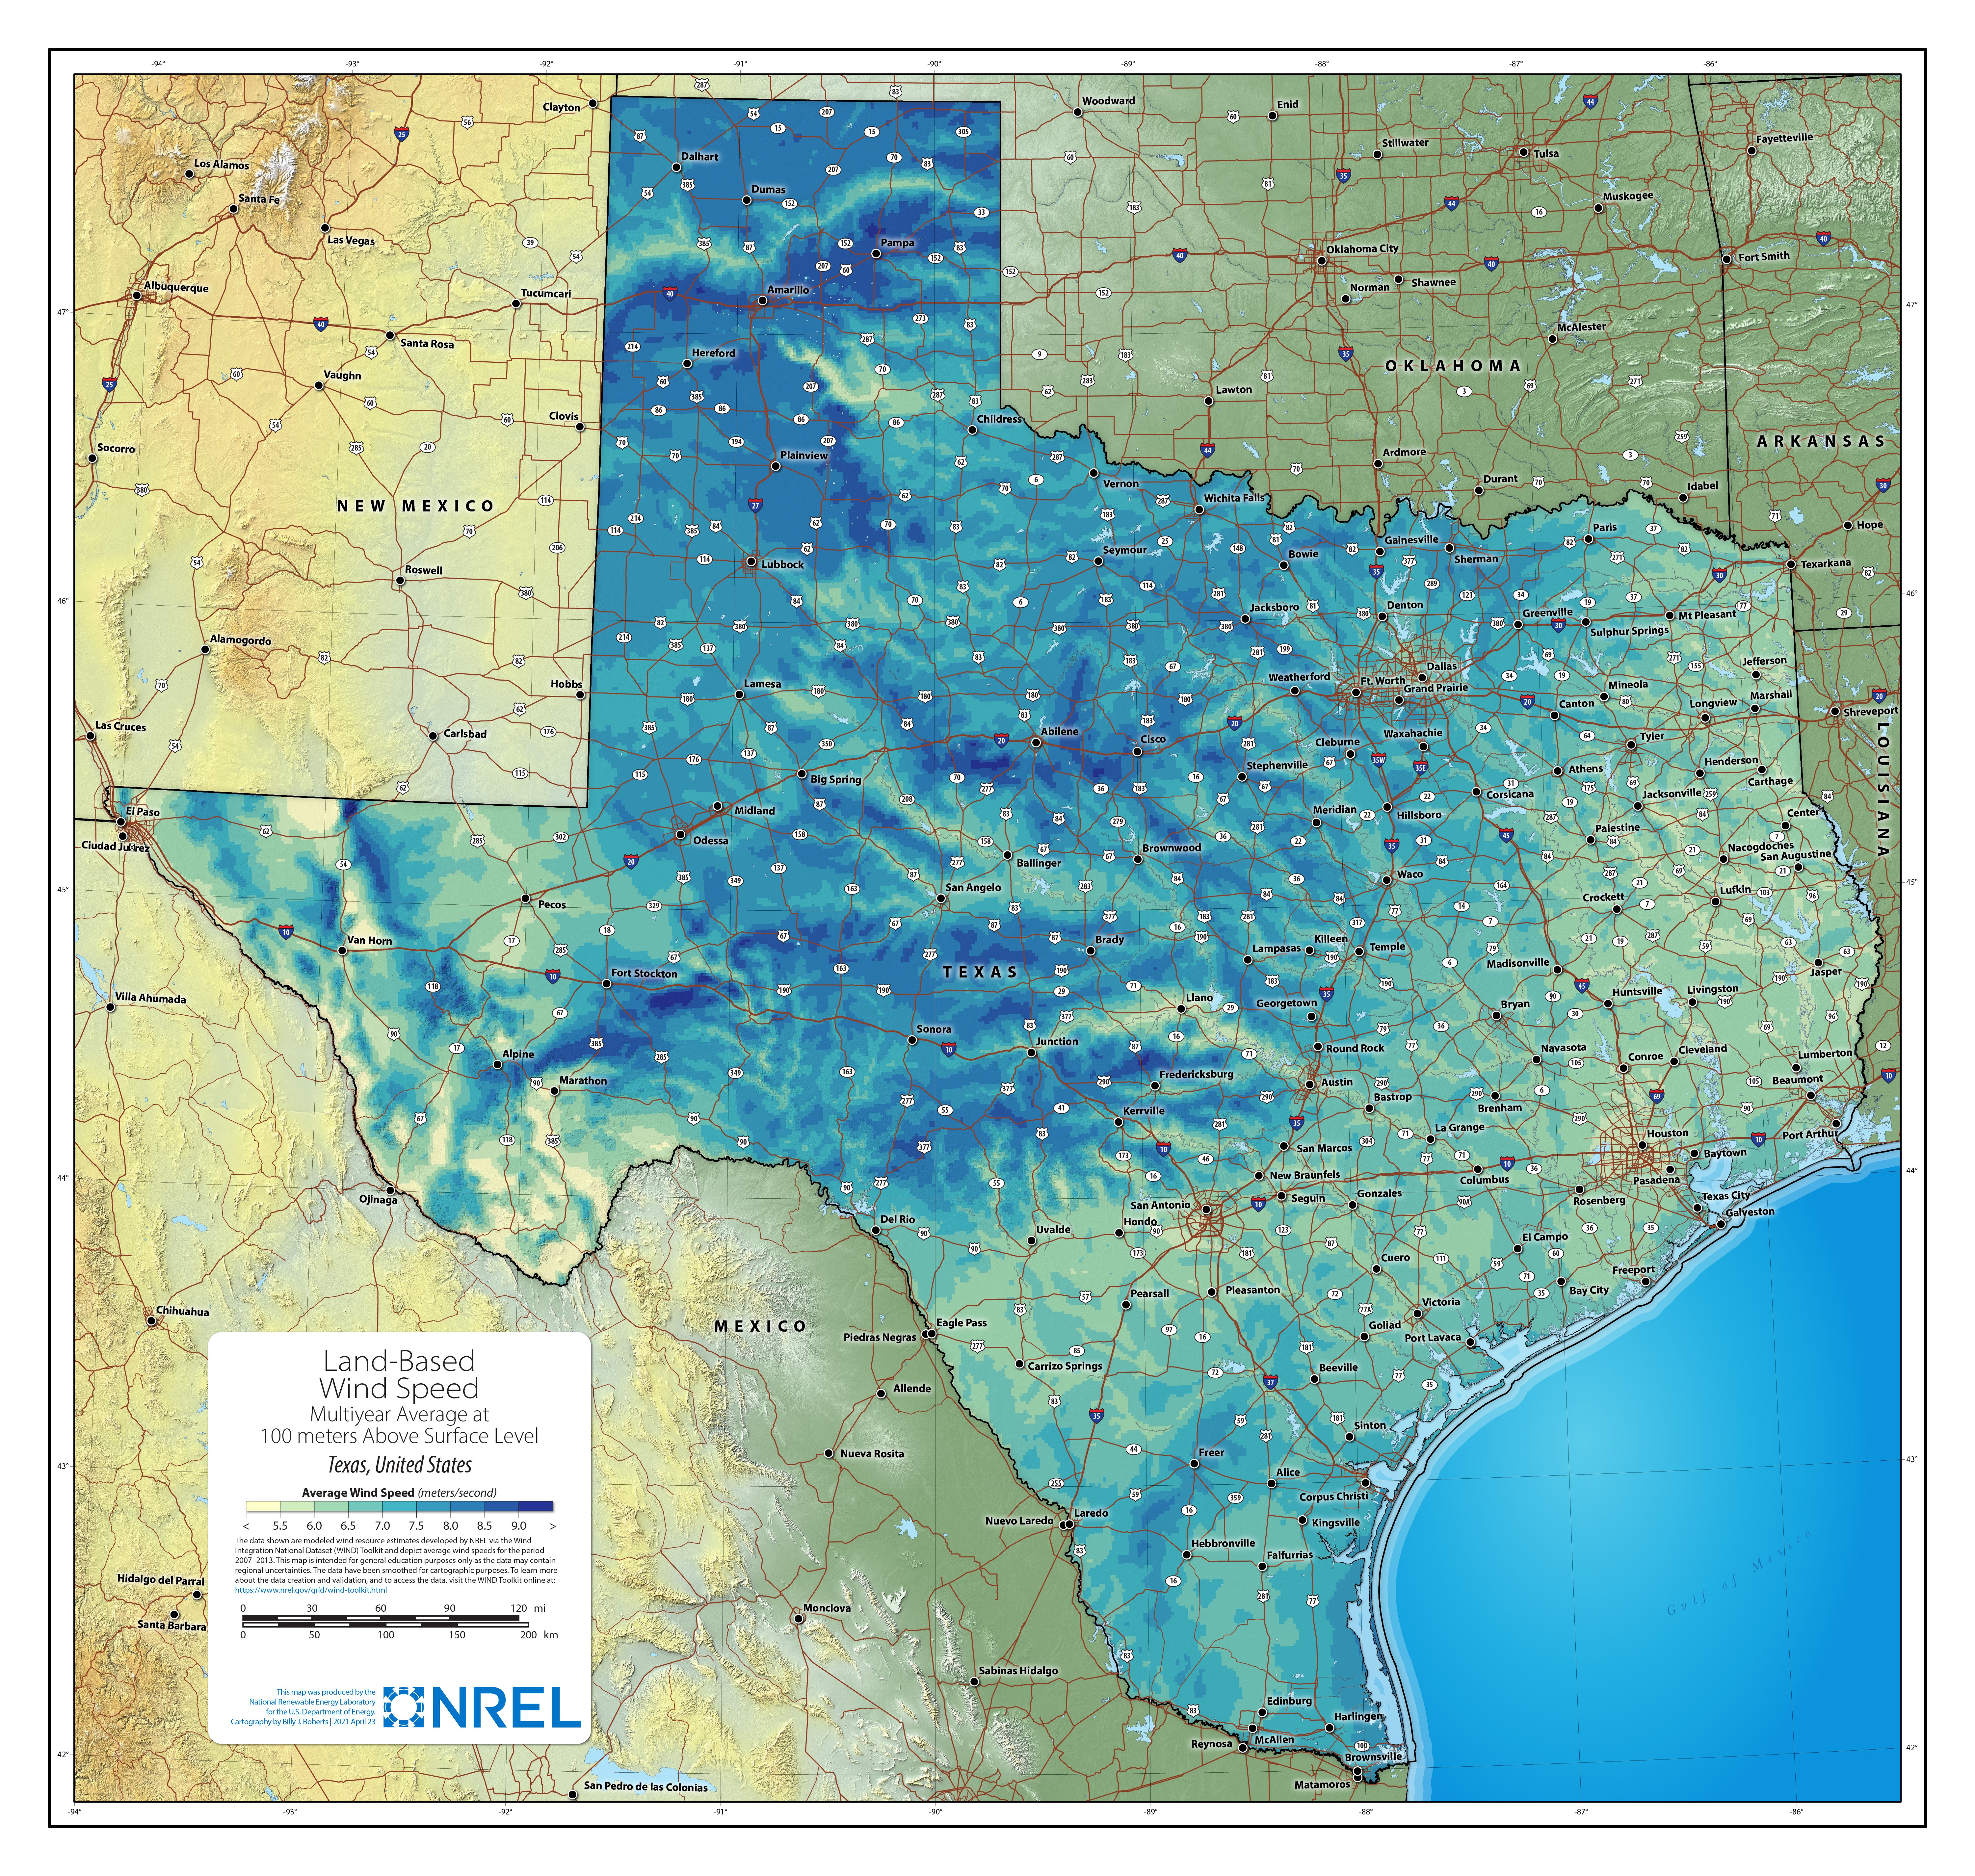
Typical characteristics depend on local planning rules and wind speeds. There are high onshore wind speeds in the Texas CREZ (Competitive Renewable Energy Zone) areas, and more recent wind farms there have a 50% plus capacity factor.
Generally the taller the turbine, the higher the capacity factor, as winds are both stronger and more consistent higher up. Duke Energy’s Mesteño Windpower Project in Starr County, Texas uses 56 wind turbines with a maximum power of 3.6 MW and a height of 590 feet (179m, ground level to the tip of the rotor when vertical).
Wind farms can suffer from NIMBY (“not in my back yard”) objections. Farmers leasing land to the wind farm have a significant incentive to back onshore wind farms, but some of the local residents who are not benefiting financially may take exception to the wind farm development.
In the UK there are discussions about possible incentives for local residents, such as half price or free electricity when the wind is blowing and the wind turbines are generating power.
There have been claims that onshore wind turbines are an eyesore, and cause local illness due to low frequency sound. However, there is no medical evidence for this, and the conclusion from research is that turbines just cause annoyance and irritation to those who do not want them, but that this is not significantly different from other causes of annoyance, such as local traffic noise.
Technology and grid connection
Large offshore wind turbines tend to be direct drive, with no gearboxes. However, the onshore wind turbine market splits between variable speed direct drive transmissions and fixed multiple speed drives with gearboxes. The reason is that onshore wind turbines are placed under less stress than offshore turbines, and it is far easier to replace onshore turbine gearboxes where necessary. So the advantages of direct drives are diluted onshore, while the costs (such as high quality AC solid state converter costs) are similar.
Because installation costs for onshore wind are much lower than for offshore wind, smaller onshore wind farms can be economic. Hence it is common to connect smaller onshore wind farms to distribution networks, as the output is not high enough to require direct connection to grid high voltage networks. Larger onshore wind farms over a few hundred MW capacity are more often connected directly to high voltage transmission grids.
Output and capacity factor
Capacity factors (average / maximum output over a period) are typically lower for offshore wind turbines, but not invariably. A capacity factor of 25-35% is typical. Onshore wind farms in the West Texas CREZ (Competitive Renewable Energy Zone) area and elsewhere have capacity factors of 50% or higher.
Cost
According to IRENA (International Renewable Energy Agency), the 2021 global installation weighted LCOE of new onshore wind power was $33/MWh (3.3 US cents/kWh) [p16-19], a reduction of 15% on 2020, or $37/MWh if you exclude China.
The IRENA document goes on to explain how the LCOE of new onshore wind is less than the cost of new fossil fuel generation in most cases.
Materials and CO2
| Material/function (t = tonnes) | Component | Mass (t/MW) | CO2 (t/t) | Total CO2 (t/MW) |
|---|---|---|---|---|
| Fibreglass / resin / plastic | Rotor | 14.1 – 23.8 | x 1.5 | 21 – 36 |
| Steel | Tower/hub | 82.2 – 111.2 | x 1.8 | 148 – 200 |
| Iron | Generator, wiring | 7.2 – 20.5 | x 1.8 | 13 – 37 |
| Copper | Generator, wiring | 0.6 – 1.6 | x 4.1 | 2.5 – 6.6 |
| Aluminium | 0 – 2.1 | x 17.0 | 0 – 36 | |
| Concrete | Foundation | 130-380 m3/MW | See “Cement” | See “Cement” |
| Cement | Foundation | 55-83 | x 1.0 | 55-83 |
| Transportation | Sea Freight Truck | 236 | ||
| Construction | Site prep Remote monitoring Erection/Commissioning Foundation | 56 | ||
| Overhead/Profit | Overhead | 8 | ||
| Manufacturing | Power Transmission Equipment Fabricated Plate Work Plastics Materials Resin | 588 |
||
| Total | 1,128-1,287 |
Materials and masses used to populate this table are from NREL 2015 “Cost of Wind Energy Review” [tab30 p65] except where linked to other sources. See also this article on wind turbine component weights.
At a capacity factor of 25-50% (the higher figure representing some West Texas locations), the total output of a 1 MW turbine over a 25 year life time would be 55-110 GWh. The savings, compared with power from coal or natural gas, would be 55,000-110,000 tonnes, or 28,000-55,000 tonnes respectively.
As can be seen, the CO2 savings from the wind power produced by an onshore wind farm, compare with power from fossil fuels, are hugely greater than the emissions caused by setting up the onshore wind farm.
However, advancing technology and focus on CO2 emissions from construction have led to two promising developments.
Currently, approximately 85% of wind turbine materials can be recycled and re-used. Up to this point, the big exception has been the wind turbine rotor. Vestas (a wind turbine maker) is part of the CETEC (Circular Economy for Thermoset Epoxy Composites) project. The project aims to commercialise a process for recycling epoxy from turbine rotors back into its individual components. These can be re-used to produce new wind turbine rotors.
A significant proportion of the materials CO2 emissions come from the steel tower. Concrete can be substituted, but also has significant emissions. RWE, a green energy company, is working with Modvion, a Swedish wood-technology company, to produce wind turbine towers from laminated wood. Weight for weight, wood is stronger than steel. The towers will be made in modular form, eliminating transportation issues with towers for the tallest onshore wind turbines.
Not only would wooden towers cause fewer emissions in construction, but they also contain embedded carbon, netting off some emissions from construction. Wooden towers are also likely to be more appealing to the public, even if, when painted, they are likely to look similar to steel towers!
Selected country status
As of the end of 2021, China had 328 GW of wind power installed, mainly onshore wind.
In 2022, China installed another 38 GW of wind power, to reach a total of 366 GW installed.
Over the last 6 years China has installed as much wind and solar power as the USA and Europe combined. In 2020 it installed as much as the rest of the world put together.
China has a 2030 target of 1,200 GW of wind and solar combined.

Although China is installing wind, solar, hydro and nuclear at a fast rate, GDP growth has been driving electricity demand higher. Although renewables contribute the majority of new generation, the rate of installation is not yet sufficient to drive down the absolute level of coal generation.
The Chinese provinces with the most wind are a long way from the population centres in eastern China. A few years ago the Chinese average wind curtailment rate rose sharply to 17% [slide 22] as long distance transmission capacity was not sufficient. The Chinese government temporarily restricted wind farm installations in Gansu and XinJiang where wind curtailments were 43% and >30% respectively.
There have since been 6 years of transmission network upgrades (adding more capacity than the total existing USA transmission network), and more targeted wind installations, and changes to regulations so that coal plants do not get priority over wind power. These transmission network upgrades reduce curtailment, though it recently peaked in May 2022 at 5.3%, due to demand reductions and increasing wind installs.
At the end of Q3 2022, the UK had 13.6 GW of onshore wind (p14), but very little has been contracted or installed since the 2015 election. Wind produced 26.8% of UK’s electricity in 2022 of which 12% was onshore wind and 14% offshore wind.
The average UK onshore wind capacity factor is 26%.
As reported by Carbon Brief, the Conservative party manifesto for the 7 May 2015 general election contained the promise “We will end any new public subsidy for [onshore wind] and change the law so that local people have the final say on windfarm applications.” Following his victory the prime minister, David Cameron did indeed issue instructions to “cut the green c**p”. After that time, no new onshore wind farms were contracted in England.
The UK ECIU (Energy and Climate Intelligence Unit) has calculated the impact of this decision and others to be to increase household bills by £1,750 in 2022, when gas prices soared as a result of various action by Putin and Russia.
In Scotland, 900 MW of onshore and 600 MW of remote island wind farms were contracted in the 2021/2022 CfD AR4 (contract for differences allocation round 4) auction (see Table E) for £54/MWh (in January 2022 pounds).
As of the end of 2022, the UK government proposed consultations on whether to change the planning rules to allow English offshore wind to be installed in areas where local communities are supportive “so that those who wish to host new onshore wind infrastructure can benefit from doing so, such as through lower energy bills” while still protecting “valued landscapes such as National Parks, Areas of Outstanding Natural Beauty and the Green Belt”.
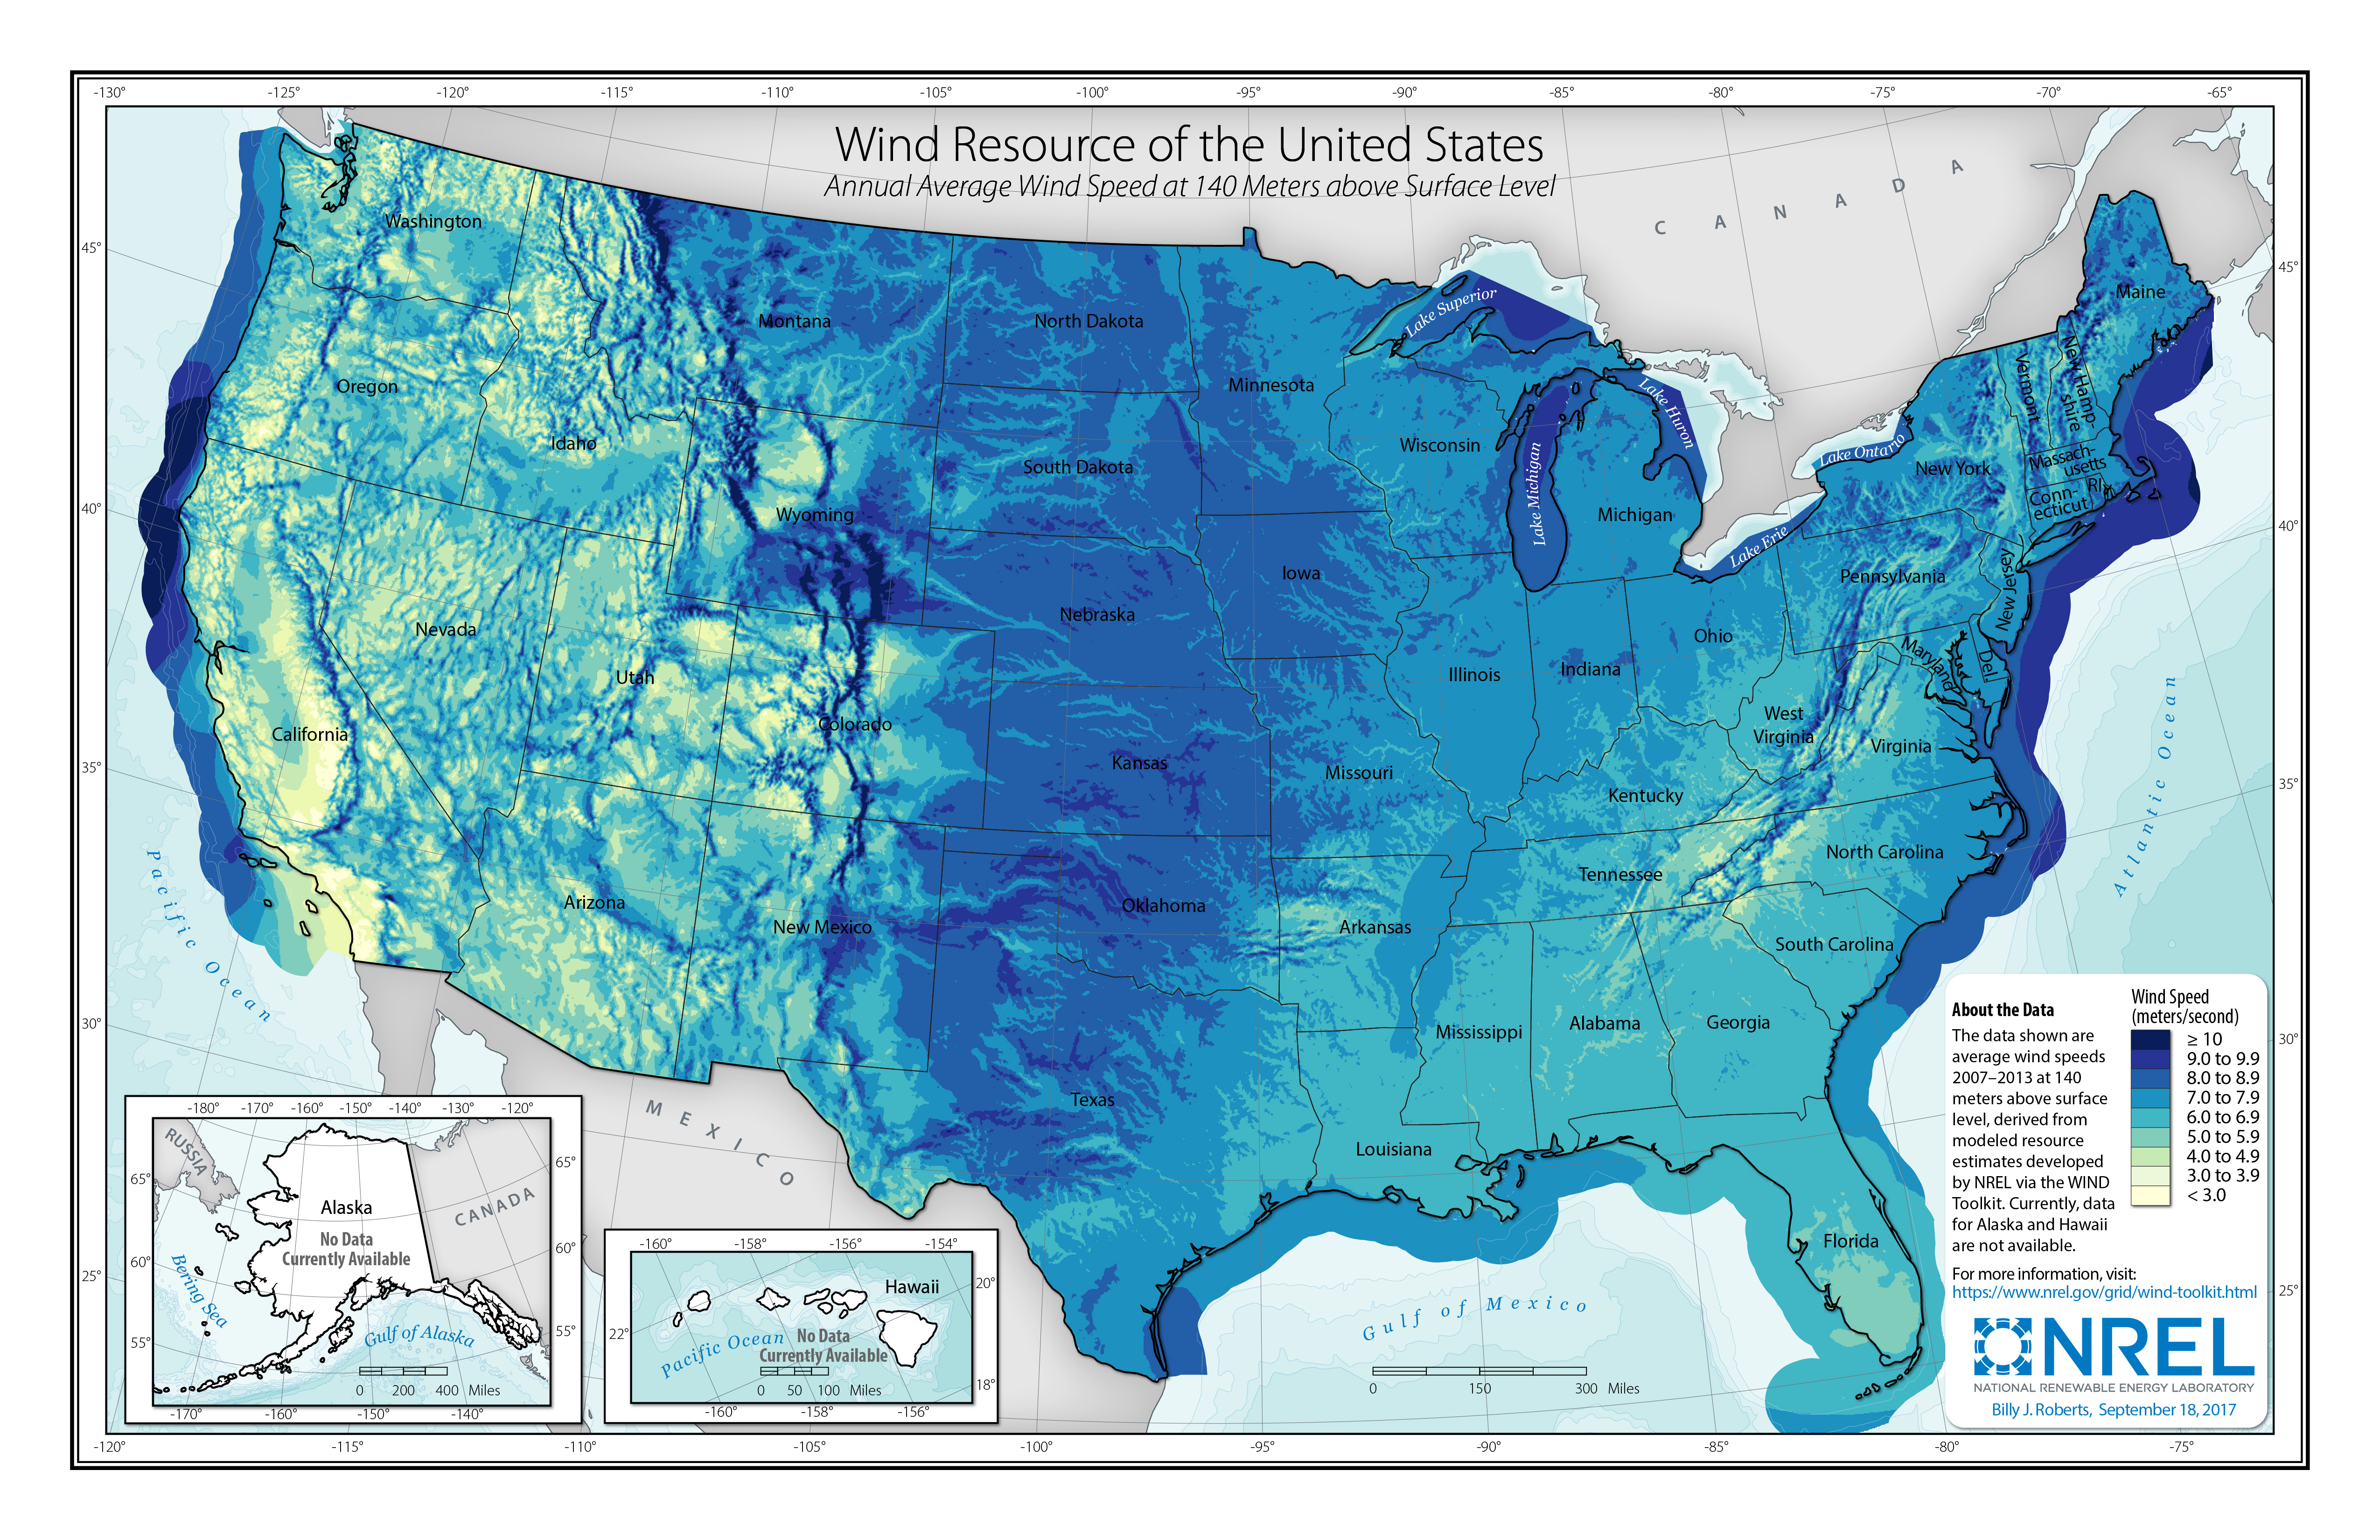
 US onshore winds are strongest down the centre, in the Great Plains and West Texas. Some central areas have wind speeds as high as 10 m/s, rivalling those for (European) North Sea offshore wind farms such as Dogger Bank. On the US east and west coasts onshore wind is weaker, but there are excellent offshore winds in many places.
\\ \\
Texas at 37 GW (27% of US wind capacity) is the US state with the most installed onshore wind capacity, generating 25% of its electricity supply in 2022 [screen 10]. Iowa and Oklahoma also make double figures with 12 GW each. In terms of US grids, the penetration of onshore wind is highest at 34.8% of load [page viii] in the SPP (Southern Power Pool) grid, which comprises regions within 17 central US states.
 As can be seen, at hub heights of 110m and 140m West Texas has large areas with potential wind capacity factors of over 50% and over 60% respectively. However, these imply turbine heights of 200m or more which may breach permitted height rules.
