
Battery theory
Battery theory
Table of Contents
Battery Types
Battery types in common use
Most current batteries use lithium. Current global lithium extraction/mining and processing capacity is constrained, so lithium prices are volatile and lithium can be expensive – there is a factor of ten difference between low prices mid 2020 and high prices at the end of 2022.
By contrast, sodium is much cheaper, and is already used in huge quantities.
Lithium NMC
NMC (lithium nickel manganese cobalt) is the de facto, standard, high specific energy battery used in a variety of applications, but is not the cheapest. The specific energy is in the range of 200-300 Wh/kg, from a variety of suppliers.
NMC batteries have the advantage of being lighter than any other battery types used in EVs. But the cycle lifetime tends to be lower, and there is a greater fire risk than for other battery types – particularly compared to LFP and sodium ion.
As of 2022, most EVs sold in the USA tended to have NMC battery packs, while those sold in China were more likely to have LFP battery packs. But this will change, with LFP battery production facilities planned in the USA.
Lithium iron phosphate
At the end of 2022, LFP (lithium ion phosphate) batteries are among the cheapest lithium ion batteries available in current volume production.
Although lithium can be expensive, iron is cheap and production is plentiful, as it is used in large quantities for other purposes. Nnitrates are extensively used as fertilisers and are thus similarly plentiful and cheap. For these reasons, LFP batteries are the cheapest form of lithium ion battery available.
LFP has a specific energy of around 160 to 220 Wh/kg, from CATL and others. This is often and incorrectly called “energy density” which strictly should be measured in Wh/l.
Compared with around 250 to 300 Wh/kg from lithium ion NMC and NCA (i.e. containing various mixtures of nickel, cobalt, manganese and aluminium), LFP has a lower specific energy (Wh/kg) and energy density (Wh/l). But it is cheaper and is less damaged when fast charged to 100%.
New arrivals/coming soon
Various battery makers have announced volume production of sodium ion batteries in 2023. CATL and Faradion are the front runners, with announcements of cells with a specific energy (often incorrectly called “energy density”) of 150-160 Wh/l. CATL claims it can increase this to 200 Wh/l before long. This article from the Shanghai Metals Market covers the announced and expected characteristics of CATL sodium ion batteries.
Sodium ion has some significant advantages over lithium ion, including over LFP. However, sodium ion cells, at only 160 Wh/kg currently, are slightly heavier than LFP (up to 220 Wh/kg), depending on which manufacturer variants of each you compare.
Sodium ion cells charge faster, can safely be discharged completely, and are much less likely to burst into flames than lithium ion cells.
Sodium ion also should be considerably cheaper, with raw materials costs around 30% of lithium ion. Sodium is much cheaper than lithium, the cathode can be cheap Prussian white and the anode can be hard carbon. Initial CATL cell costs are expected to be $77/kWh, possibly reducing to $40/kWh on very high volume production.
The initial market for sodium ion battery cells is expected to be grid storage batteries, but there is no obvious reason why sodium ion batteries should not be used in low BEVs (pure battery electric EVs) to minimise costs, at the slight expense of higher weight and lower acceleration. The reason for this is that both current LFP and expect sodium ion batteries have similar specific energies of around 160 Wh/kg. During 2022 around half of Tesla BEVs produced used LFP batteries, and in China almost no other technology is in use for electric vehicles (including both electric cars and electric buses).
Faradion sodium ion batteries are expected to have a lifetime of 3,000 cycles. This compares with over 7,000 cycles for CATL LFP cells. However, it would represent 600,000 miles or 1 million km lifetime when used in an EV with a 200 mile/320 km range, or around 20 years when used as a grid battery with a full cycle every 2.5 days.
There is an excellent video going into some detail of the different potential chemistries for sodium ion batteries, from Billy Wu of Imperial College – as much as you ever wanted to know about the state of the art.
M3P lithium tri-metal phosphate
As of April 2023, CATL is expected to deliver these M3P cells in volume to Tesla very soon (if they haven’t already).
M3P battery cells are based on LFP (lithium iron phosphate) cells in which the iron has been replaced with zinc, aluminium and manganese. The “M3” appears to stand for “three metals”, though one report says the third metal is magnesium and not manganese. The expectation is that M3P cells will have a roughly 15% higher specific energy than LFP cells. Thus the specific energy is expected to be 240-250 Wh/kg compared to 210-220 Wh/kg for the latest CATL LFP cells.
M3P cells should be distinguished from LMFP (lithium manganese iron phosphate) cells. LMFP cells are based on LFP cells to which manganese has been added to achieve a specific energy of 230 Wh/kg. M3P cells omit iron but include zinc and aluminium.
Amprius says it has delivered a lithium ion battery with a silicon nanowire anode, which has a specific energy of 450 Wh/kg. This compares with Tesla NMC batteries believed to have 260 Wh/kg. So the Amprius battery has a 73% higher specific energy. Amprius has also announced that its batteries can be charged to 80% in 6 minutes.
Right now, the Amprius battery is very expensive to produce, can only be produced in small quantities, and is probably only affordable for defence or possibly space applications.
Silicon anodes can store ten times as many lithium ions per unit weight as carbon anodes, but solid silicon anodes swell up. Cracking is a major problem, and lifetime is low. Amprius says it has solved this problem with silicon nanowires of different lengths attached directly to a substrate, which do not crack. But it is not saying what the cycle life of its current batteries is. It has commented that in the lab it has achieved 500 Wh/kg with more than a 500 cycle lifetime.
The real significance of 450 or 500 Wh/kg specific energy is that the aviation industry is saying this battery specific energy is sufficient for short-haul electric planes to become technically and economically viable. However, this depends on Amprius getting to volume production of these batteries at a price affordable for electric aviation.
There is an ACS article “Performance Metrics Required of Next-Generation Batteries to Electrify Commercial Aircraft” which claims that batteries for regional short haul electric planes would require a minimum of 500 Wh/kg, but this states it does not make allowance for possible energy savings compared to conventional planes, such as boundary layer ingestion and distributed propulsion.
CATL has also announced a 500 Wh/kg battery specifically for use in short range electric planes.
Other types coming later
Here is a video from Undecided, interspersed with ads, which covers some other types of batteries coming later, perhaps, and potentially suitable for EVs or consumer electronics, and which may supplant or supplement lithium ion. It includes summary information on the following battery types:-
- lithium NMC (nickel manganese cobalt – for comparison)
- sodium ion
- lithium sulphur
- aluminium ion
- niobium
Battery technology NMC LFP M3P Sodium ion Silicon nanowire
anode
Leading producers ACE,
CATL
etc.CATL CATL, Faradion Amprius
Specific energy Wh/kg 200 - 300 160 - 220 240 - 250 160 -‡200
‡later (CATL)450 -*500
*later
Cycle life 2-3,000 4-8,000 3-6,000 200-1,200
>*500
Estimated cell cost/kWh $100 $80 - 120 ?, $88
$77-*40High, unknown
Charge rate 80% 15 mins (3.2C) 80% 6 mins (8C 10C*)
Uses Electronics, EVs, grid EVs, grid EVs EVs, grid Electric planes, EVs
Volume production Now Now Very soon 2023/24 2023/24
Low temperature 80% @ -10C 90% @ -20 C ?
Fire safety Mediocre
Good ? Very good ?
EV battery types by year

See p38 of IEA Critical Minerals Market Review 2023.
The designations such as NMC 532 indicate the molar (atomic) ratios of the material nickel (5 units) to manganese (3 units) to cobalt (2 units).
The general trend over this period is away from battery types (and NMC ratios) with more cobalt and towards the battery types and NMC ratios with less cobalt or none. LFP contains no cobalt.
Starting in 2023, sodium ion batteries (with no cobalt, lithium, nickel or manganese) will be introduced in increasing quantity into the low-end of the BEV market – and likely into all stationary storage.
Be a little careful reading charts of percentages such as these related to EV sales per year. Global EV sales are increasing by 50% or more each year. What looks on the chart to be a reduction year by year in the use of a specific material, can actually turn out to be a significant increase in the actual quantity used each year, as measured in megatonnes of that material used or GWh of battery capacity produced which contain it.
The losses in a battery charge / discharge cycle are almost completely caused by voltage drops, not charge in coulombs or number of electrons transferred in and out. The efficiency of the charging, in terms of coulombs of charge transferred in and out, is invariably well over 99%. But the battery terminal voltage at a given state of charge (measured in coulombs) can be significantly higher than the battery terminal voltage at the same state of discharge (in Coulombs). This causes a direct reduction in efficiency.
There are two big factors which determine the efficiency of a lithium ion battery charge/discharge cycle.
Firstly, the level to which it is charged is important. The overvoltage required to push further charge into a battery is higher when the battery is nearly charged than when it is half full or nearly empty. The extra voltage generates heat. This wastes input energy and thus reduces charge/discharge efficiency.
Secondly, the speed of charging or discharging generates heat. A battery on charge or discharge has an effective internal resistance (not necessary the same all the time). The energy moving into or out of the battery on charging or discharging is I \times V, while the resistive heat losses are I^2 \times R, where I is the current at that time, V is the terminal voltage, and R is the internal resistance. Thus the resistive losses (as heat) are roughly proportional to the speed of charging or discharging (there may be other factors). Slow charging or discharging generates proportionately less heat than fast charging, and thus increases the round trip efficiency.
A charging rate of 1C represents charging a battery from empty to full in 1 hour, and a higher rate represents faster charging. So 2C would be charging from empty to full in half and hour. The same measure applies to discharge rates.
Mobile phone batteries charged during the day typically need to be charged as fast as possible, with no regard for efficiency.
EV batteries on a long journey are often fast charged at rates of 3.2C, which is an 80% charge in 15 minutes. When charging at home, charging rates are usually restricted to 7 kW, 11 kW, 14kW or 22kW. For a 70 kWh EV battery these would represent charge rates of 0.1C, 0.16C, 0.2 or 0.3C – all pretty low. Losses will thus be low. All but 7kW would require a 3-phase electricity supply.
However, most grid batteries have a duration of 2 hours, 4 hours, or more, for which the charging rates are thus 0.5C, 0.25C or lower. Losses are thus proportionately lower and this contributes to the higher round trip efficiency of grid batteries compared to the same battery technology used in mobile phones.
As an example, the Powin specification sheets for 4 hour (0.25C) charge and discharge stationary battery stacks using either EVE LF280K or CATL CB310 LFP battery cells claim a DC 95% round trip efficiency. The 2 hour stacks have a 93% DC round trip efficiency.
The latest Tesla Megapack has an overall (AC to AC) efficiency of 93.5% for the 4 hour duration and 92% for 2 hour duration. This will include charging AC to DC losses and discharge DC to AC losses. It is believed that this now uses LFP battery cells, as the size and weight went up, but the stored energy went down compared with the previous Tesla Megapack specification, which had a round trip efficiency of 90.5% for 4 hours and 87% for 2 hours.
Note that these numbers may apply only to LFP battery cells
EV LFP batteries may also have similar round trip energy efficiencies when slow charged (7 to22 kW). When fast charged at up to 3C (150 to 250 kW), the battery round trip energy efficiencies will be noticeably lower, due to I^2R losses with currents 20 or 30 times as large (and 1/20th or 1/30th of the duration). Losses on charging from empty to full are proportional to the current.
A 2018 article on different battery types from the Queensland Government, Australia, talks about a round trip efficiency of 89% for LFP, 97% for lithium cobalt oxide and 75% to 95% for lithium manganese oxide. However, it is a little dated (the current LFP efficiencies claimed by Powin and Tesla above are higher) and does not reference where it got the figures from or how they were measured.
To achieve the highest battery electrical efficiency, batteries should thus be charged and discharged as slowly as possible, and restricted to a maximum charge which would depend on the battery technology, such as 80%. However, charge/discharge efficiency is not necessarily the most important factor at any point in time.
See this Powertech article for safety aspects of various types of Lithium ion battery.
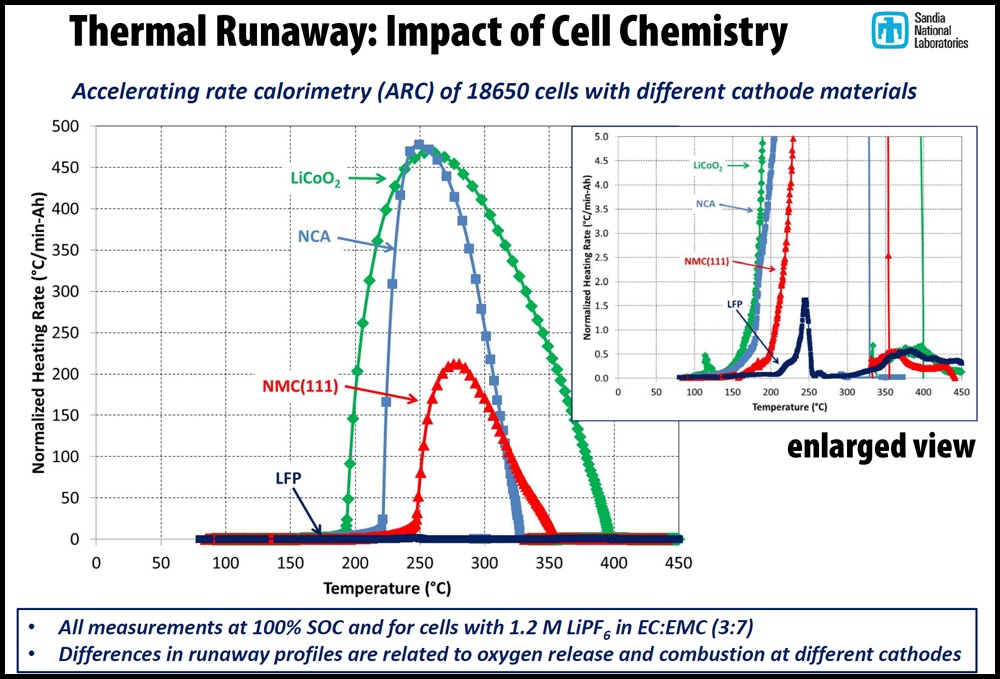
The main safety hazard from lithium ion batteries is thermal runaway, which causes fires. The risk is highest with LCO (LiCoO2) and NCA (nickel cobalt aluminium) battery cells if any portion of a cell gets too hot. NMC is less prone to this but fires can still occur, both in EVs and in grid batteries.
However, it is much more difficult to get LFP cells to catch fire, even if you are trying! Note that the relative heating from LFP is small enough that it does not register on the main graph above, and you have to zoom in by the factor of 100, as displayed in the inset, to see it.
Sodium ion battery cells have a negligible fire risk from thermal runaway.
A nail test is used to test the possible results of collisions of electric vehicle, and this gives similar results for the different battery chemistries, with LFP and sodium ion coming out best.
The Amprius lithium cell with silicon nanowire anodes also performs well in a military test, at least in the earlier 390 Wh/kg cell.
The various types of cells have different cycle lives, varying from 2,000 to 8,000 cycles, except for Amprius silicon nanowire batteries, which are expected to last somewhat more than 500 cycles.
A 2,000 cycle life down to 70% of original capacity in an EV with a range of 300 miles would give roughly a 300 mile x 85% x 2,000 cycles = 500,000 mile battery lifetime. 85% is the average between 100% and 70%, and assumes straight line degradation of capacity. 500,000 miles would likely be well beyond the total miles driven by a private EV before it is scrapped.
However, a long distance electric semi heavy duty truck might be averaging 500 miles per day for 260 weekdays per year, with a ten year lifetime. For a 500 mile range battery, this would be 2,600 cycles, and a 2,000 cycle lifetime battery cell time down to 70% might not be sufficient.
Grid battery storage might be at least partially charged and discharged each day. A 2,000 cycle lifetimes might last no more than 6 years, which is likely not sufficient to justify the investment.
However, a grid storage battery with an 8,000 cycle lifetime would last 24 years, which would represent a more reasonable investment period.
As an example, the Powin Stack230E and Stack360E BESS (battery energy storage system) products containing CATL CB310 LFP battery cells are guaranteed for 20 years and 7,300 cycles, down to 66.6% of original capacity. 7,300 cycles is one cycle per day for 20 years.
Thus it can be seen that different battery applications have significantly different cycle lifetime requirements.
Some battery types, and particularly LFP, have a relatively flat voltage vs SOC (state of charge) curve, as this chart from an article by LG Energy Solution (comparing LFP batteries with its NCM batteries) makes clear.

The flatness over a wide range makes it difficult to estimate the state of charge of LFP batteries, with errors in the range of 10-15%. The discharge curve also moves down on increasing discharge rate, due to the internal resistance of the battery, and also moves with varying temperatures.
Thus, estimating the state of charge of some batteries taking only the discharge (or charge) voltage has significant errors.
Coulomb counting
An alternative approach is to use a device to count the number of coulombs going into, and coming out of the battery. This calculates a reproducible state of charge to within 1%. However, it does depend on setting some reference point, such as “empty” or “fully charged”. PowerTech describes the use of such devices (and makes them) for LFP batteries, which use regular recalibration from known battery states of charge. The advantage is that the reading does not vary based on instantaneous load or temperatures at the time of charge or discharge.
Battery production CO2 emissions
The main difference in CO2 emissions between producing a fossil fuel car and producing a BEV (pure battery electric vehicle) is the emissions for producing the battery.
Strictly, battery production emissions will depend on the battery chemistry.
Batteries from more modern production plants will have lower emissions than from older plants. Newer processes require less energy input. Grids become greener over time. Production plants can also install local solar panels or tap into local green generation to provide zero emissions power.
It is more difficult to eliminate emissions from input materials mining, than from production plants. However, various strategies can achieve this, including recycling of battery materials. But clearly battery recycling won’t occur in volume until the first generation of EVs are scrapped.
There are various estimates for battery production emissions.
McKinsey estimates 74 kg CO2/kWh for new batteries and 53 kg CO2/kWh for batteries using recycled materials (which clearly cannot provide volume until later).
Carbon Brief lists estimates from various publications. Those since 2017 have generally been in the range of 61 to 106 kg CO2/kWh. The 61 kg CO2/kWh lower estimate assumes the production plant is powered entirely by zero emission power.
The Carbon Brief report cited above estimates a 2 year payback on CO2 emissions from buying a BEV vs a comparable fossil fuel car.
Beware of any research studies which summarise research papers produced before 2016 – battery production emissions have been considerably lowered since then.
The new CATL battery production plant in Sichuan Province, China has been certified as zero emissions. Thus 61 kg CO2/kWh is an entirely practical target for batteries produced at such a plant.
EV battery CO2 payback
For a 75 kWh battery pack (giving a 300 mile range in a Tesla model 3), battery production emissions of 61 kg CO2/kWh causes total battery production emissions of 4.6 tonnes of CO2 per EV.
The UK grid emissions intensity in 2022 was 182 gm CO2/kWh. For an EV doing 3.5 miles/kWh = 5.6 km/kWh, the emissions would thus be 33 gm CO2/km.
The 1.2L non-hybrid Toyota Corolla has emissions of 153 gm CO2/km, so the difference in emissions/km between that and an EV with battery cells from CATL, Sichuan, China is 130 gm CO2/km
Average UK mileage is 7,500 miles/year = 12,000 km/year. So the CO2 payback is 1.56 tonnes/year, and the decision to buy such an EV with a 75 kWh battery (with 4.6 tonnes manufacturing emissions) would pay back in 3 years from a CO2 perspective.
Scotland has a lot of wind power, and thus a grid emissions intensity of roughly 25% of the UK grid as a whole. This might result in savings in EV emissions per km of 145 gm CO2/km instead of 130 gm CO2/km. But it only shortens the payback time vs a fossil fuel car by around 3 months.
USA drivers average 12,000 miles/year = 20,000 km/year. But emissions in different US states vary considerably. In 2019, 43% of US BEV sales were in California. Further, fossil fuel cars in the US tend to be bigger and have considerably higher CO2 emissions – no one is going to be driving a 1.2L Toyota Corolla. The 2020 California average grid emissions intensity of 45 mtonnes/197 TWh \approx228 gm CO2/kWh means the CO2 savings per km from buying an EV would likely be at least as high as the UK. The increased mileage means the payback period vs a fossil fuel car would be less than 2 years.
California has a lot of solar power. Some EVs would mainly be charged during the day, when power is cheapest and grid emissions intensity lowest. But, as with EVs charged in Scotland, this wouldn’t reduce the CO2 payback time by more than a few months.
Table of Contents
Useful additional links
- CATL will Mix Cheaper Sodium Ion Batteries With Lithium for Acceptable Range EVs
- Sodium-Ion Cell Characteristics
- Sodium-ion batteries released by CATL, potentially threats to Li-ion batteries
- Will sodium-ion battery cells be a game-changer for electric vehicle and energy storage markets?
- How much CO2 is emitted by manufacturing batteries?
- Impact of energy storage systems on the management of fault current at LV network with high penetration of distributed generation
- Battery University articles (comprehensive, but about 5 years out of date)
- CATL M3P battery cell now in volume production
- Tesla Plans to Swap Nickel-Based Batteries for Safer, Cheaper LFP Alternative
- ElectronicsForu: Six Most Important Lithium-Ion Battery Chemistries
- US DoE: 2020 Grid Energy Storage Technology Cost and Performance Assessment