
Green hydrogen
100 MW green hydrogen demonstration project between Sumitomo, Tokyo Gas and ITM power
Green hydrogen
Table of Contents
General

- Green – from electrolysis powered by renewables
- Yellow – (a recent term) from electrolysis powered by solar power. It thus also qualifies as green hydrogen.
- Pink or purple or red – from electrolysis powered by nuclear
- Grey – from natural gas via methane steam reformation with CO2 released into the atmosphere
- Blue – from natural gas via methane steam reformation with capture and storage of CO2
- Turquoise– from natural gas via methane pyrolysis. The outputs from this are hydrogen and solid carbon, which can be stored underground.
- Black – from hard, black coal with CO2 released into the atmosphere
- Brown – from lignite with CO2 released into the atmosphere
- White – naturally occurring (very limited quantities)
Green H2 uses
Grid backup fuel
Where wind and solar dominate a grid, there will be times when there will be surplus wind and solar power. The excess can be fed to electrolysers to produce green hydrogen, which can be stored in depleted oil and gas wells or man made salt caverns. When backup power is required to fill long-duration gaps in wind and solar, this stored, green hydrogen can fuel gas turbine generation or hydrogen fuel cells.
The round trip efficiency for power to hydrogen to power is estimated at 43-45%. Thus it is important that the fraction of demand which is supplied by such backup power is low – below 10% is a sensible target.
To get below 10% of demand from backup is often straightforward using a mix of complementary renewables with 4-8 hours of grid battery storage and/or pumped hydro storage. Demand response (grid controlled scheduling of flexible loads) can be used to reduce the quantity of grid storage required. Most EV charging has flexibility of a few days to a week in when to charge. Heat pumps backed by some hours of thermal storage (e.g. a well insulated water tank of a few cubic metres) have more limited flexibility, but that still reduces expensive grid battery storage requirements.
Loads such as electric arc blast furnaces can postpone heavy power use indefinitely, as the store of output materials effectively avoids the need for continuous production. Thus these loads do not require (or not require as much) backup power for long duration gaps in renewables.
The likelihood is that most road transport will become pure battery electric in the future. Green hydrogen as a transport fuel has low efficiency (less than 50% for the cycle power to hydrogen and back to power), while battery efficiency in an electric vehicle is typically 85-95%, and at the higher end of this range with slow charging.
There are two ways of powering a vehicle with hydrogen. The most efficient is with HFCs (hydrogen fuel cells), supported by batteries, driving one or more electric motors. The other method is with a standard ICE (internal combustion engine) drive, as for a fossil fueled vehicle, which is less efficient. The latter is similar to current LNG (liquid natural gas) vehicles, which can also be dual fuel.
Using hydrogen in ICE vehicles raises the possibility of modifying existing ICE vehicles to become zero emissions, prior to replacing them with electric vehicles. So it could result in faster reduction of road transport CO2, prior to ICE vehicles reaching the end of their lifetime (averaging something like 16 years for light vehicles such as cars).
Generally, HFC vehicles do not have enough (expensive) HFCs to provide good acceleration on their own. To provide sufficient HFCs would make the vehicle unnecessarily expensive. The HFCs can provide enough power to keep the vehicle at maximum cruising speed. But they have to be supplemented with battery power to accelerate up to cruising speed in a reasonable time. The batteries are charged, using any surplus power from the HFCs at lower speeds, and from regenerative braking when slowing down.
< 500 miles/day
As of March 2023, some tens of Tesla semi pure battery electric class 8 / HGV truck cabs (tractors) have now been delivered, with a 500 mile range at full 82,000 lbs load. Various electric trucks from other producers, with range less than 500 miles, are now in production.
So daily distances below 500 miles are likely to be served by electric trucks. It is thus unlikely there will be a big market for heavy duty, hydrogen trucks used mainly for daily distances of less than 500 miles per day.
> 500 miles/day
A recent report from BNEF indicates that heavy-duty, long distance trucks will be electric, not hydrogen. Hydrogen truck sales peaked in 2023, and have since been declining. It looks like the market has made up its mind.
Thomas Walker of GreenBiz expressed significant doubt as to whether long range, heavy duty, electric trucks would be a good commercial solution for trucks travelling more than 500 miles per day. This is primarily because batteries large enough to travel 500 or more mile per day at full load are heavy, and subtract from the maximum payload of the vehicle. The payload is the weight of cargo that is allowed on the truck, given that the gross weight it typically restricted to 42 tonnes in Europe and 82,000 lbs in North America.
Walker claims that the total cost of ownership is lower for long-haul, heavy duty HFC trucks than for their pure battery electric equivalent. But the example given is for multi-shift (multi-driver) operation which avoids the necessity for 30 minute stops for a rest break after 8 hours (US) or 45 minutes after 4.5 hours (EU) of driving, for single driver operation. A Flexible Services and Manufacturing Journal article says that European logistics is normally single driver, except when security is a concern, but explores the possible advantages of two-driver teams.
For an opposing view see this November 2023 article by Pierre-Henry Deshayes on the Barrons web site. He suggests that hydrogen trucks will only be required for niche types of haulage, such as multi-driver operation, large overnight loads such as wind turbines, or locations such as islands where there is no power grid.
As of March 2023, heavy duty hydrogen trucks were produced commercially or proposed by a number of manufacturers, including:-
- Hyundai Xcient up to 34 tonnes (from 2020)
- Hyzon (from 2021, now stopped trading)
- Nikola Tre (from 2022 but went bankrupt early 2025)
- Daimler GenH2 (originally expected 2027 but now “deferred” until the early 2030s )
- IVECO, VDL H2Haul EU project (demonstrator with 16 vehicles, not yet complete)
- SAIC Hongyan, China (plans for 3,000 vehicles/year, but this has undergone significant restructuring)
At present, around 20% of aviation fuel and CO2 emissions are from short haul flights, with 80% from long haul.
Short haul
Amprius silicon nanowire (lithium ion) batteries are available in small quantities with specific energies of 450 Wh/kg and 500 Wh/kg. These are sufficiently light to allow short haul electric planes, with range less than 1 hour or 1000 km. These may take over from kerosene fueled short haul jet planes from 2030.
Long haul
There is very little chance there will be batteries with sufficient specific energy for long haul flights within a few decades. There is thus a need for an alternative, chemical, fuel for long haul aviation.
Liquid hydrogen is an obvious zero carbon option for long haul aviation. In particular it is very light, with a very high specific energy compared with other energy sources as follows:-
- Liquid hydrogen – 33,000 Wh/kg.
- Kerosene (jet fuel) – 12,000 Wh/kg.
- Ethanol – 8,300 Wh/kg.
- Methanol – 5,500 Wh/kg.
- Liquid ammonia – 5,200 Wh/kg.
- Amprius (high specific energy) batteries – 500 Wh/kg.
Weight is key to aviation (but not to the same extent for shipping, where volume is a bigger consideration). Although liquid hydrogen tanks have to be double lined to avoid boil off, they weigh considerably less than metal tanks at 700 bar (atmospheres) required to store sufficient compressed hydrogen gas.
However, liquid hydrogen is difficult to produce and store – it must be compressed and cooled, stored in highly insulated containers, then heated to gasify it again before use.
Thus liquid derivatives of hydrogen could be more advantageous.
Green ammonia is much easier to handle and can be produced from green hydrogen. It can thus serve as an energy carrier for green hydrogen. But ammonia is highly toxic in large concentrations. It can easily be detected by smell, and disperses rapidly when dry, as it is lighter than air. But it is hydrophilic (absorbs and retains water easily), and when wet it hangs around near the ground and drifts with the wind. There are some possibilities for improving the safety of ammonia fuel in planes, and the number of plane crashes is very low anyway. If the safety risks can be be minimised, ammonia may be a possibility.
Green methanol or green ethanol are possibilities. But, as well as using green hydrogen as an input, both syntheses require a source of carbon that does not cause net CO2 emissions. Plant material might provide a suitable feed stock.
Sustainable biofuels are another possibility, and are already available. They typically require no (or little) modification to existing planes. But they are much more expensive than kerosene jet fuel at present. The ICCT suggests [p12] they may provide one third of energy for aviation by 2050.
Even if green ammonia or green methanol eventually become the fuel of choice for long haul aviation, green hydrogen would still be required to make them.
Considerable research and development must take place before deciding on a global aviation industry solution. Because of the interconnected global flight routes, new types of aviation fuels must eventually be available around the world. Clearly it would be advantageous to have one new aviation fuel type and not multiple ones.
The current consensus seems to be that electric ships with a range of up to 50 miles are feasible, and beyond that chemical fuels are required.
This is at odds with the prediction that short haul battery electric planes can have a range of up to 1,000 miles. Shipping requires a much smaller energy use per tonne-km of freight moved than air freight – 0.09 MJ vs 9.77 MJ / km / tonne, which is only 1% . It is surely technically feasible to build battery electric ships with a much larger range than 50 miles. However, cost is also a factor. Aviation is much more expensive than shipping, and batteries may end up being half of the weight of battery electric short haul planes Anything approaching such a ratio would be far too expensive for shipping, compared with current low shipping rates.
Range < 50 miles
For regular journeys of less than 50 miles, battery electric drive has significant cost advantages. Charging can be overlapped with loading cargo or passengers, provided suitable port facilities are made available.
Range > 50 miles
- 12 – hydrogen
- 72 – methanol (including dual fuel ships that can run on fossil fuel bunker fuel also)
- 0 – ammonia
Chemical feedstock

Hydrogen is already in extensive use by industry, with some 94 Mtonnes used in 2021, causing 900 Mtonnes of CO2 emissions, according to the IEA.
Note that most of the current demand is for hydrogen for refineries, and to create ammonia and methanol, mainly not used as fuels. It does not include any significant use of hydrogen to produce ammonia or methanol to be used as fuel for backup power or transport is described above.

In many countries, the hydrogen produced by electrolysis would currently be fed by electricity generated mainly by burning fossil fuels. This is likely to transition to renewable electricity in the future.
Most hydrogen used as a chemical feedstock has to be converted from fossil fuel form to another form, involving energy losses. This increases the price of the fossil fuel pathway, so making it easier for green hydrogen to become competitive. Whereas transport uses fossil fuels with partial, and thus less expensive, conversion from crude oil. For use as a chemical feedstock, green hydrogen will become competitive with grey or blue hydrogen earlier than when used as a transport fuel. This could changed if there are new government regulations on CO2 emissions, subsidies for green hydrogen or carbon taxes are added for CO2 emissions from fossil fuel burning.
2022 to 2030

The chart above is from a November 2022 BNEF article “A Breakneck Growth Pivot Nears for Green Hydrogen” which describes the current situation and project pipeline.
At the moment very little green hydrogen is being produced – 200,000 tonnes per year according to the BNEF chart above. In a December 2020 article, Recharge estimated the electrolyzer pipeline as 250 GW. New projects are added every month and the pipeline is likely over 270 GW now. For a 50% load factor and 70% efficiency, 270 GW of electrolysers would produce around 25 Mtonnes of green hydrogen per year (as the energy in hydrogen gas is 33.6 kWh/kg).
The BNEF estimate of 2030 hydrogen production is also 25 Mtonnes per year. In 2022, almost all the 94 Mtonnes per year of hydrogen production was grey hydrogen. So the current pipeline of electrolyzers, large though it may seem, equates on to the decarbonisation of only 27% of current industrial hydrogen production. The new uses for green hydrogen outlined above create additional hydrogen demand over and above that for 94 Mtonnes per year.
A December 2022 article from Aurora Energy Research summarises its data base of projects. Its bottom up analysis of electrolyser projects shows the electrolyser pipeline has expanded to 957 GW, though only 11% of projects are more advanced than early planning. 202 GW of projects are for delivery by 2030. Aurora Energy Research estimates global electrolyser production will be 30 GW per year by 2025 – higher than the 18 GW (=39 GW – 21 GW) shown in the November 2022 BNEF chart above.
2050 Demand
Grid backup
Assume 2050 global electricity demand of 100 PWh/year, and that backup from green hydrogen is required for 5% of that.
\begin{array}{l l l} \text{2050 electricity demand}&= 100 & \text{PWh/year}\\ \text{fraction of backup}&= 5\% & \\ \text{backup demand}&= 5 & \text{PWh/year}\\ &=5 \times 10^{12} & \text{kWh/year}\\ & & \\ \text{hydrogen specific energy} &= 33.6 & \text{kWh/kg (of heat)}\\ \text{CCGT efficiency}&= 60\% & \\ \text{hydrogen specific energy}&= 33.6 \times 0.6 & \text{kWh/kg} \\&= 20.2 & \text{kWh/kg (of electricity)}\\ & & \\ \text{backup hydrogen requirement} &= 5 \times 10^{12} / 20.2 & \text{kg/year}\\&= 2.5 \times 10^{11} & \text{kg/year}\\&= 250 & \text{million tons/year }\end{array}
\begin{array}{l}\text{2050 electricity demand}\\ \qquad = 100 \text{ PWh/year}\\ \text{fraction of backup}\\ \qquad = 5\% \\ \text{backup demand}\\ \qquad = 5 \text{ PWh/year}\\ \qquad =5 \times 10^{12} \text{ kWh/year}\\ \\ \text{CCGT efficiency}\\ \qquad =60\%\\ \text{hydrogen specific energy}\\ \qquad = 33.6 \text{ kWh/kg (of heat)} \\ \qquad = 33.6 \times 0.6 \text{ kWh/kg (of electricity)} \\ \qquad = 20.2 \text{ kWh/kg (of electricity)}\\ \\ \text{backup hydrogen requirement} \\ \qquad= 5 \times 10^{12} / 20.2 \text{ kg/year}\\ \qquad= 2.5 \times 10^{11} \text{ kg/year}\\ \qquad =250 \text{ million tons/year }\end{array}
Long distance truck haulage
See the BNEF chart below.
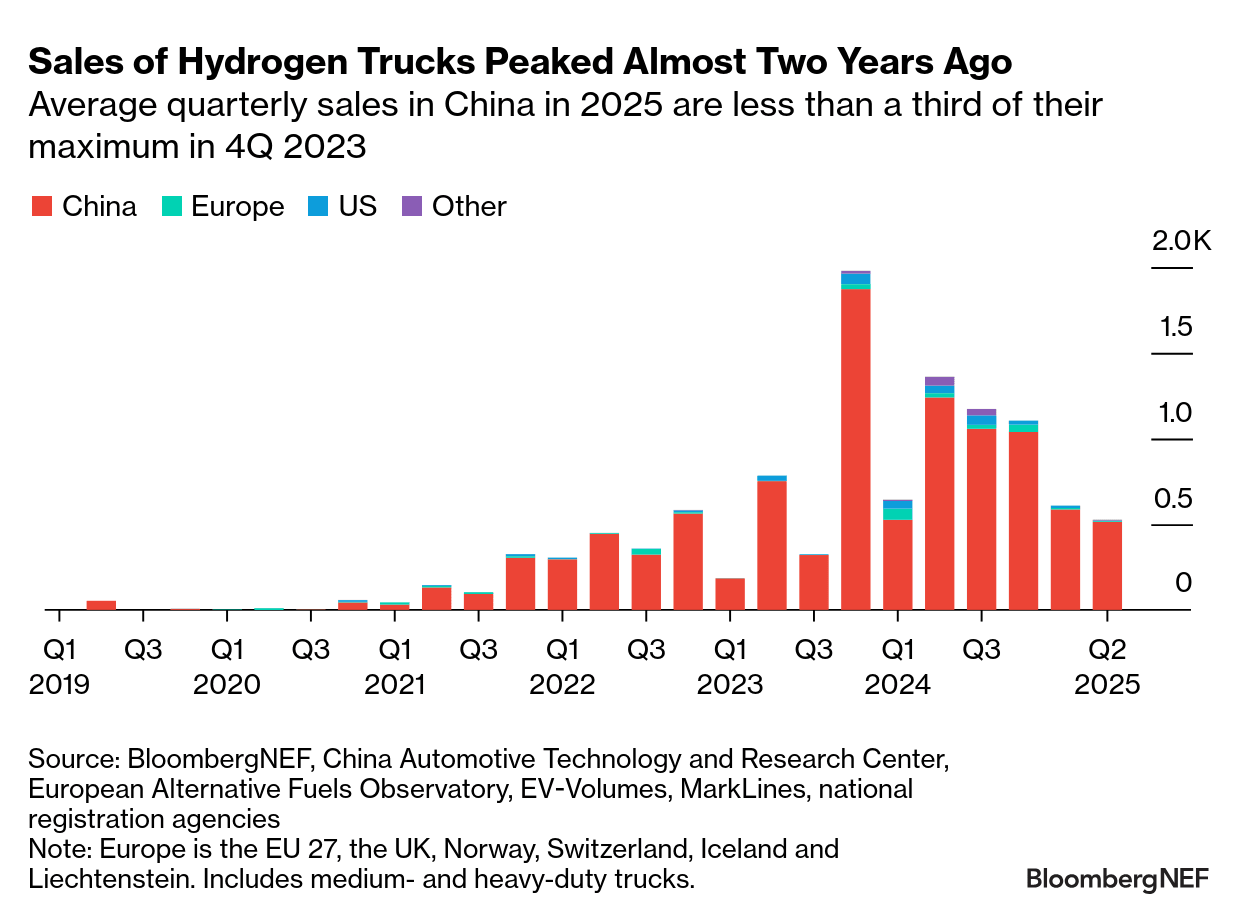
However, here is an older estimate of the maximum likely hydrogen fuel requirement for heavy duty, long distance HFC trucks. It uses 2021 tonne-km data from EU freight journeys, but assumes this is representative of global road freight.
From EU “2021 Road freight characteristics by journey characteristics” [5/6th of the way down], the categories 300 to 1,000 km is conservatively split so that 2/7 of the tonne kms category is 800 km (500 miles) and over, which gives a total of 587,449 out of 1,15,595 million tonne km is for journeys over 800 km, which is 31%.
Some trucks are likely to do over 800 km (500 miles) on some days and under 800 km other days. However, some of the trucks with daily mileages over 800 km might be electric trucks recharged at megawatt chargers during drivers’ mandatory rest stops of 30 or 45 minutes.
In view of both the above factors, 31% is arbitrary increased to 35% to cover the maximum expected freight tonne-kms covered by heavy duty hydrogen trucks, with 65% of the tonne-kms expected to be covered by electric trucks.
This ratio is assumed to apply globally. Note that fewer than 35% of the heavy duty goods vehicles will be HFC (hydrogen fuel cell) vehicles, because these tend to be the vehicles travelling the highest distances, and quite possibly the highest average payloads.
Our World in Data gives global transport CO2 emissions as 8 gigatonnes per year in 2018, of which 29.4% is for road freight. One litre of diesel produces 2.7 kg of CO2 emissions.
The expansion of road transport freight by 2050 will be something like a factor of two (my estimate). Lower factors are quoted for developed regions, but the growth from developing regions is likely to be higher, and will bring the global average up.
According to Volvo, large truck diesel engines achieve 50% efficiency. The best fuel cells achieve a 60% efficiency, according to the US Department of Energy. Putting this together:-
\begin{array}{l l l}\text{2018 global transport emissions}& = 8 &\text{Gt}\\ \text{road freight fraction}& = 29.4\%& \\&= 2.35 &\text{Gt}\\ \text{CO}_2\text{ emissions}&= 2.7 &\text{kWh/litre}\\ \text{2018 diesel use}&= 870 &\text{billion litres/year} \\ \text{2050 growth factor} &= \times 2 & \\ \text{2050 diesel requirement}&= 1,670 &\text{billion litres/year}\\ & & \\ \text{energy in diesel }&= 10 &\text{kWh/litre}\\ \text{efficiency of diesel engine}&= 50\%& \\ \text{energy in hydrogen gas }&= 33.6 &\text{kWh/kg} \\ \text{efficiency of hydrogen fuel cell}&= 60\% & \\ & & \\ \text{2050 hydrogen equivalent} &= 414 & \text{billion kg/year} \\ &= 414 & \text{million tonnes/year} \end{array}
However, note that this is an upper bound for the hydrogen required for long distance trucks. If affordable battery specific energy (Wh/kg) increases by another factor of two by 2035, from 250 Wh/kg to 500 Wh/kg, then almost all long distance transport is more likely to be pure battery electric than hydrogen fuel cell based. So the lower bound of the requirement is zero.

The EUROCONTROL chart above shows statistics for flights taking off or landing in Europe.
The assumption here is that 78% of CO2 emissions from aviation are produced by worldwide flights over 1,500 km (938 miles), as well as flights to or from Europe. This same 78% ratio of long haul CO2 emissions is assumed to apply globally in 2050.
In ICCT’s June 2022 report “Vision 2050 – aligning aviation with the Paris agreement“, assuming no action on climate change, the central estimate for 2050 is that aviation will emit 2,200 Mtonnes of CO2 per year. Burning kerosene emits three times its weight in CO2, so this implies 2050 use of 730 Mtonnes of kerosene per year. The long haul flights would use 78% of that which is 570 Mtonnes of kerosene per year.
Kerosene provides 12 kWh/kg of heat, while hydrogen provides 33.6 kWh/kg of heat. Thus the long haul aviation requirement will be for at least 200 Mtonnes of hydrogen. The efficiency of converting energy in hydrogen to energy in methanol is roughly 66%. So 300 Mtonnes of hydrogen might be required if the fuel used on long haul flights is methanol instead of hydrogen.
Thus a first cut estimate is that 200 to 300 Mtonnes of green hydrogen will be required by 2050 for long haul flights.
Sustainable aviation biofuels are another possibility, which can fuel existing vessels with little modification. The ICCT suggests [p12] they may provide one third of energy for aviation by 2050.
Shipping > 50 miles per day
The IRENA 2021 document “A pathway to decarbonise the shipping sector by 2050” [p15] provides an estimate of 46 Mtonnes per year of green hydrogen. Of this, the report suggests 73% would be used to produce green ammonia, 17% to produce green methanol, and 10% used directly as green hydrogen.
Chemical feedstock
94 Mtonnes of mainly grey hydrogen were used as chemical feedstock in 2021, causing 900 Mtonnes of CO2 emissions, according to the IEA. Note that around 45% of this is used in oil refining, which may largely become unnecessary by 2050, due to the green transition.
Similarly to the estimate of the growth in freight, the assumption will be that the use of hydrogen as a chemical feedstock will double to 188 Mtonnes of green hydrogen between 2021 and 2050. This excludes the use of hydrogen to produce fuels for the backup and transport uses itemised above.
This estimate has a higher level of uncertainty than the others. Considerable quantities of grey hydrogen are currently used in oil refineries. However, by 2050, the quantity of refined oil should be negligible.
Here is a summary of my indicative (not definitive) estimates for 2050 green hydrogen demand. The details are under the sections for the individual estimates above.
| Hydrogen use | Minimum demand (mtonnes/year) | Maximum demand (mtonnes/year) |
|---|---|---|
| Grid backup | 250 | 250 |
| Long haul road freight | 0 | 414 |
| Long distance aviation | 200 | 300 |
| Shipping > 50 miles/day | 46 | 46 |
| Industry feed stock | 188 | 188 |
| Total | 684 | 1,198 |
Treat this as a rough indication only. Time will tell.
In its report “Net Zero by 2050” 4th revision (October 2021) [p47] the IEA projects a 2050 requirement for 520 million tonnes of green hydrogen per year.
A DNV report summary forecasts 3,100 GW of electrolysers by 2050, with a global hydrogen demand of 320 million tonnes per year, with certain exclusions.
However, the full report (which requires free registration to download) estimates that the 2050 cost of green hydrogen will be $2/kg from dedicated renewables, which seems high for electrolysers in the sub tropics powered by solar, which is already under $20/MWh in many places. It seems unlikely that blue hydrogen will be able to compete with green hydrogen by 2050, yet the report expects considerable production of blue hydrogen.
In a Focus report, Roland Berger has an estimate for 2050 European use of green hydrogen [p5].
Michael Liebreich has been CEO and is now Chairmand of the Advisory Board of cBNEF (Bloomberg New Energy Finance). He has written a series of 3 articles on hydrogen over some years. The most recent one is less optimistic about the potential uses of green hydrogen than my Summary above. The articles are:-
- Separating Hype from Hydrogen (October 2020)
- The Unbearable Lightness of Hydrogen (December 2022)
The best storage for green hydrogen depends on the circumstances. The devil is in the detail. In this section, the intent is to give a flavour of the main considerations involved in deciding how to store hydrogen for a particular use. There are more details and options described in the subsections below.
For static applications such as grid backup, storing hydrogen as a gas under pressure is fine. There are often plenty of depleted oil and gas wells in a region, or scope for man made salt caverns. They work well and are cheap. The compression does not waste too much energy in the overall process.
For mobile applications the key metric is typically the ratio of the weight of hydrogen stored to the total weight of the storage including containers.
The US DoE amended down [p3] its targets for the weight ratio (hydrogen vs system weight) for hydrogen storage for light duty vehicles (cars and vans) in 2017 to be 5.5% by 2025 and 6.5% ultimately. The intent is to provide a range of 300 to 500 miles, which is similar to the range obtainable for petrol and diesel vehicles with a full tank.
Hydrogen gas at one atmosphere provides 33.6 kWh/kg of energy. But storage in heavy solid steel tanks with hydrogen at up to 700 atmospheres typically provides overall hydrogen energy storage of no more than 1.4 kWh/kg, once the weight of storage tanks is are added in. So the effective weight of hydrogen in the storage structure is only around 4%. This might be fine for ships, and possibly, trucks, but may not work for long haul aviation. The hope is that storage of hydrogen in solids, and carbon wrapped hydrogen gas storage tanks can beat this 4% figure.
Liquefaction of hydrogen uses at least 12.8% of the energy of the hydrogen stored, and there will be continuous hydrogen boil off, depending on the maximum pressure the storage tanks can withstand. The boil off does not necessary matter for uses such as aviation, where you would refuel just before the journey anyway, and the fuel is then used continuously after that. But for other uses, such as hydrogen fuel cell road vehicles, it is a potential safety issue and would eventually result in escape of all the fuel you might have been relying on to get you home from the airport!
Compressed hydrogen gas in bulk underground storage is likely to be stored at a pressure of at least 200 bar (atmospheres), assuming pressures similar to those for underground storage of natural gas. Such storage includes depleted oil and gas wells and man-made salt caverns. The salt caverns can be made by dissolving the inner portion of large salt deposits with water.
There are not many underground hydrogen storage caverns in use as yet, and the maximum hydrogen storage pressure used so far is 150 bar. There are many more such caverns currently used to store natural gas, with higher pressures.
Gaffney Cline has produced a useful article on the storage of hydrogen in salt caverns, depleted oil and gas reservoirs, and aquifers.
The dollar and energy cost of pressurising hydrogen to such levels is not too high. Because of hydrogen’s low density, compression of hydrogen to 1,000 bar costs around 2.6 kWh/kg (compared to 0.2 kWh/kg for the much heavier air), which is around 8% of the energy stored in the compressed hydrogen.
Air Liquide has one such large (grey) hydrogen storage facility in Texas, but it is not on the scale required to decarbonise the Texas grid.
For mobile applications, solid metal tanks provide only about 4% storage of hydrogen by weight. Increasing the pressure enables more hydrogen storage, but the tank thickness also has to go up to withstand the increased pressure. So the percentage weight of hydrogen stored tends to stay the same!
According to the US DoE, compressed hydrogen gas storage at pressures up to 700 bar in carbon composite tanks with a liner looks promising. Such tanks are under development, and may eventually give weight ratios up to 6.5%, weight of hydrogen vs storage system weight. But they are expected to be more expensive.
- A double insulated container is required
- There will be continuous boil off, so the hydrogen slowly disappears into the atmosphere. So liquid hydrogen is best for short term, rather than long term ,storage.
- Liquefaction of hydrogen requires an additional 12.5% of energy compared to the energy stored in the liquid hydrogen. Contrast that with 8% for compressed hydrogen gas at 1,000 bar.
- The hydrogen must usually be regasified (boiled to form a gas) before use, but this is often not an issue because the boiling temperature is around -250\degreeC. The heat from sea water, or from the use of the hydrogen, is sufficient to do this.
- The process of liquefying hydrogen to a stable state is not as straightforward as it may seem – see the subsection on “spin isomers of H2 below”.
This might seem like an esoteric topic, but is relevant to the practical liquefaction temperature and liquefaction process of hydrogen.
A hydrogen molecule consists of two electrons, and two hydrogen nuclei (which are just single protons, unless we are talking about atoms of deuterium or tritium isotopes of hydrogen). All these have quantum mechanical property called spin.
By the rules of quantum mechanics, at normal temperatures, the two electrons in a hydrogen molecule will usually have “anti-parallel” spins, which mean they are in opposite directions to each other, so the rules of quantum mechanics means they can occupy the two spin slots in the same, lowest-energy, molecular orbital. This would not be possible if the spins were parallel to each other – one of the electrons would have to be in a higher-energy orbital. There is no problem here.
But the nuclei also have spins, and the lowest energy state of a hydrogen molecule also requires these to be anti-parallel (opposite directions), rather than parallel (identical directions). Think of the nuclei as two tiny bar magnets, which would prefer to align a N pole on one nuclear with the S pole of the other. Otherwise there is a tiny force pushing them apart.
An H2 molecule with an anti-parallel nuclear spin pairing is known as “parahydrogen” or “para” (anti-parallel spins) state H2 as opposed to “orthohydrogen” or “ortho”(same spin direction) state H2.
Unfortunately, hydrogen at room temperature or above consists of up to 75% ortho hydrogen (i.e. not at the lowest energy level).
If you rapidly cool H2 down to the temperature where it turns into a liquid, the proportion of ortho hydrogen remains roughly the same (75% ortho). But over a matter of days, rather than hours, the molecules will slowly and spontaneously relax from ortho to para form, releasing roughly 1.5 kJ/mole as they do. Unfortunately, the energy required to vaporise liquid hydrogen is only 0.9 kJ/mole. You may well think, for a while, that you have successfully liquefied the hydrogen. But over a matter of days, up to half of it can then boil away, even with no external source of heat.
One solution is to pass cooled hydrogen over a catalyst (e.g. iron oxide or activated charcoal) which encourages the conversion from ortho to para form, releasing heat in the process. Further cooling down to 20 K (-253 C), and appropriate insulation, will then allow it to remain as a stable liquid for some time.
Another approach is to continue cooling for many days to remove the heat caused by the slow, spontaneous conversion from ortho to para state, but this may be less convenient.
If you think liquefaction of hydrogen is complicated, just don’t ever get involved with liquid helium production and storage!!

Hydrogen gravimetric capacity of proposed storage materials for hydrogen fuel
Image: US Department of Energy, Wikimedia Commons
Hydrogen is very light, and has a very low (volumetric) energy density (Wh/litre). Absorbing it into a solid could dramatically increase its volumetric energy density. This would avoid the need for heavy pressure tanks or cryogenic storage with significant “boil off” rates.
The figure of merit sought be researchers is the fractional increase in the weight of the solid once hydrogen has been absorbed by it. Other requirements are that the hydrogen should be released (“desorbed”) at temperatures below 100°C, and the material can be recharged at pressures below 700 bars. The normal requirement is for the adsorption to be reversible within the vehicle fuel tank. So a process in a large industrial facility for producing a powder containing hydrogen which can easily be released by heating it in an fuel cell vehicle, is not necessarily what is required.
For mobile uses, there is not much point in using complicated storage of hydrogen in solids if the percentage weight of hydrogen stored versus system weight cannot beat the existing 4% ratio for compressed hydrogen gas storage in metal tanks, or beat the expected future 6.5% ratio for composite carbon fibre tanks.
There are multiple techniques for storing hydrogen in the form of a solid (or liquid). Some involve a true chemical change where hydrogen is added throughout the bulk solid (or liquid).
The others do not rely on chemical changes to the hydrogen itself, but use (naturally or artificially) nanostructured materials that have a huge surface area to volume ratio. The hydrogen is absorbed on the surface of either a metal or some other material.
The hydrogen would be pressurised and absorbed by the solid at a low temperature, which must be below the “sorption” temperature. The sorption temperature is the temperature above which the metal will release the hydrogen.
Desirable sorption temperature must be above the likely temperature of the solid in its normal use, though this can also be set by refrigeration. For hydrogen fuel cell vehicles, ideally, it would be sufficiently above the normal temperatures experienced by the storage tank on a very hot sunny day.
To recover the hydrogen, the solid with hydrogen absorbed must be heated above its sorption (/desorption) temperature in the correct quantities, so that the pressure of hydrogen generated does not exceed the requirements for use or the strength of the container.
The volume of a system for storing hydrogen within a solid (or liquid) will be considerably less than the storage volume for hydrogen as a compressed gas, even though there may be a requirement for both pressure vessels to withstand 700 bar, even if only during recharging.
The pressure determines the thickness of metal or other material required. The weight of the pressure resisting material is thus dependent on the surface area A of the tank, while the volume stored is proportional to A^{3/2}. If you double the diameter of a cubic or spherical tank, you provide 8 times the volume for 4 times the weight of a tank. Thus, for hydrogen storage within a solid, the lower volume means that less of the system weight is the pressure tank, and more of it is the weight of the material in which the hydrogen will be stored.
Delivery of H2
Pipelines
Flow rate
Hydrogen has a volumetric energy density (kWh/l) about one third that of natural gas (methane). So the energy moved for a given hydrogen pipeline flow (in cubic metres per second past a fixed point) is one third what it would be for the same natural gas flow.
Fortunately, the molecule weight of hydrogen is 2, compared to 16 for methane, so the ratio of molecular weights is 1/8th. The physics then means that the speed of the molecules in hydrogen, relative to the speed in methane, is \times \sqrt{\frac{1}{1/8}} = \times \sqrt{8} = \times 2.83 \approx \times 3 compared to natural gas (methane). Or put another way, natural gas is naturally about 3 times as viscous as hydrogen.
The implication is that the energy flow in the form of hydrogen, through a pipe of a given diameter, for the given pressure difference, is very similar to, but not quite as high as, the energy flow using natural gas through the same pipe using the same pressures. This is a very handy result!
Pipeline embrittlement
A hydrogen ion is just a proton with no electrons, so is small enough to get into the spaces in between the metal ions in a metal lattice. Hydrogen is thus known to embrittle metals, which means care must be taken when switching existing metal pipes from natural gas to hydrogen.
Nowadays, all new, and most existing pipes on a low pressure gas distribution system are plastic, rather than metal, and are not embrittled by the use of hydrogen.
Further, hydrogen can only embrittle metals when it is present in the form of individual hydrogen atoms or ions, dissociated from an H2 molecule. This dissociation happens primarily when hydrogen is wet, or in solution. One strategy to stop embrittlement of high pressure metal pipes by hydrogen is thus to dry the hydrogen before passing it through the pipes. This and various other, relevant topics are covered in a discussion with Tony Green, Hydrogen Director of National Grid. One conclusion of the discussion is that roughly 70% of the existing natural gas network assets of the UK and EU are suitable for operation with green hydrogen.
Shipping
Liquid H2
Liquid organic H2
Costs
Green H2 & electrolysers
There is an S&P Global regional hydrogen price comparison “wall” giving current prices of hydrogen by region and various method of production. The February 2023 wall showed the current green hydrogen price range from alkaline electrolysis from $2/kg (US: Gulf, midcontinent, SE) to around $10/kg (UK). Green hydrogen from PEM electrolysis was from $4-5/kg in Australia to $9-12/kg (Japan, Netherlands, UK).
The low USA prices are likely the result of US tax credits for wind and solar farms.
Currently, electrolysers are relatively expensive. In 2020, IRENA [p65-66] considered the current electrolyser stack and system costs of the two main types to be:-
(Proton Exchange Membrane) | ||||
| Electrolyser stack costs | ||||
| Total system costs | ||||
However, there is a huge expansion of installed electrolysers coming. In its November 2022 article “A Breakneck Growth Pivot Nears for Green Hydrogen“, BNEF forecasts growth in electrolyser installed capacity from 2 GW at the end of 2022, to 242 GW by the end of 2030. That is a factor of \times 121 expansion.
There are thus significant opportunities for developing huge economies of scale in producing electrolysers. Components produced in a custom manner can be converted to mass manufacturing. High volume production lines can be set up. Cost saving investments become easily justifiable.
Nel, a Norwegian electrolyser maker, has set a target for its customers to be able to produce green hydrogen for $1.50/kg by 2025, when fed by renewable power at $20/MWh or lower (which surely has to be cheap solar PV power, not unsubsidised wind power). This implies an electrolyser total system cost of $320/kW, a 70-80% reduction in current costs.
In June 2021, the US DoE announced a “Hydrogen Shot” target cost of $1/kg for green hydrogen within a decade, as the first in a DoE series of “Earth Shots”. Thus the $1/kg is a DoE target for 2021.
Green vs fossil fuel H2

The cost of hydrogen from natural gas via methane steam reforming depends on the cost of natural gas. The cost of natural gas in 2018 seems in line with normal 2010s natural gas prices, before Putin and the Ukraine war caused them to increase. The USA saw a much smaller increase than Europe. The US Henry Hub (natural gas distribution hub in Louisiana) natural gas prices over the last 25 years are shown in the IEA chart below.

With the predicted reductions in green hydrogen costs above, you can see where this is all leading.
If Nel meets its 2025 target above, when fed by solar PV power at less than $20/kWh (likely in the sub-tropics), electrolysis should be able to produce green hydrogen at $1.50/kg. This would be competitive in most places with blue hydrogen from natural gas via methane steam reforming with CCS (carbon capture and storage). And it would also be competitive with grey hydrogen (similar but without CCS) in some places. Even at modest natural gas prices.
In the places where and when the US DoE 2031 target of green hydrogen at $1/kWh is met, green hydrogen should be competitive with natural gas everywhere.
There are some ifs and buts around this. To achieve such low prices, a region has to have access to green power at $20/MWh or less. In other regions, prices will only be that low if there is cheap hydrogen pipeline transmission (see below) from regions with cheap supply. Green hydrogen tanker transmission (in whatever form) may not be cheap enough to allow it to compete with grey hydrogen from methane steam reforming with no CCS.
Green hydrogen could be substantially more competitive with hydrogen from fossil fuels sooner than these dates wherever grey hydrogen production is subject to a carbon tax.
At this point, there needs to be a reminder not to get too carried away with the good news above. Green hydrogen will be competitive with fossil fuel hydrogen at some point in various places. But the figures do not yet show that green hydrogen (or derivatives) is on track to become competitive with natural gas for uses such as domestic heating, or transport fuels.
Transport costs
| Transport mode | Carrier | Per 1,000 km $/kg | Distance 12,000 km | |
| Onshore pipeline | Compressed H2 gas | 0.16 (0.12- 0.23) | ||
| Offshore pipeline | Compressed H2 gas | 0.23 (0.19-0.35) | ||
| Shipping | Ammonia | 2.5 | 2.1 | |
| Shipping | Liquid H2 | 3.1 | 1.9 | |
| Shipping | LOHC (liquid organic H2 carrier) | 2.4 | 1.8 | |
The figures in the table above are from Roland Berger: Hydrogen transportation and European hydrogen backbone: Estimated investment & cost.
Please treat the figures in the table as indicative, and read the source documents for the caveats and conditions for them. The Roland Berger document also covers land-base train and truck shipments.
The European hydrogen backbone report discusses a proposed 53,000 km European hydrogen backbone network costing €80-143 with 60% repurposed natural gas pipelines and 40% new hydrogen pipelines.
Pipeline transport costs are mainly set by the capital cost of the pipelines, which depend on the distance.
Shipping of bulk materials is normally very efficient and cheap. Thus the majority of the costs for shipping hydrogen are to do with the transformations to the hydrogen to prepare it for shipping, and restore it to gaseous hydrogen on arrival.
A Recharge article also discusses the likely cost savings from shipping hydrogen as liquid ammonia instead of liquid hydrogen
Table of Contents
Useful additional links
- Video – is ammonia the future?
- IRENA hydrogen briefing document
- IRENA 2021: A pathway to decarbonise the shipping sector by 2050″
- ZEV Transition Council: Heavy-duty zero-emission vehicles. Pace and opportunities for a rapid global transition
- International Journal of Hydrogen Energy: Route to zero emission shipping: Hydrogen, ammonia or methanol? (paywalled)
- Hydrogen transportation : The key to unlocking the clean hydrogen economy, October 2021
- European hydrogen backbone: Estimated investment & cost
[Last updated 14 October 2025]