[Updated December 2024]
Wind and solar farms are variable power generation sources. There will be times when the sun is not shining (such as at night) and the wind is not blowing. There will be both short and long duration gaps in wind and solar power output. If wind and solar are the main, and cheapest, generation on a regional grid, then these gaps must be filled.
Grid battery storage is suitable for storing some of the surplus wind and solar power, and holding it over for discharge in short duration gaps in renewables. With around 8 hours of average load of storage capacity, it is suitable for filling short-duration gaps of less than a day. With 20-30% of wind and solar over-generation, such a storage duration could fill 2/3rds of the gaps (measured in GWh). The remaining 1/3rd of longer gaps are more suited to backup by gas turbine generation, fueled by green hydrogen from electrolysis. The green hydrogen would be stored underground in depleted oil and gas wells.
Pumped hydro is the best way to fill both short and long duration gaps in wind and solar, provided sufficient storage capacity can be provided by the geography, which is rarely the case.
While the full capacity of one grid battery can be used to perform some of the functions below at the same time, it cannot necessarily do everything. For instance, if it is already discharging at its maximum rate to time shift energy, it cannot provide synthetic inertia, as it cannot then increase its rate of discharge.
For that reason, if a grid battery installation contracts to provide both energy time shifting and grid services, then the operators must partition both the energy storage capacity and the rated power capacity of the battery, to split the battery capability between the two functions.
However, at times, a grid battery may be able to effectively inject or absorb considerably more power than the contractual minimum. For instance a battery charging at its peak power, perhaps for energy time shifting, can switch instantly to discharging at its peak power, if required for stability purposes, providing a net power injection of twice its rated capacity (or of the rated charge capacity plus the rated discharge capacity if these two are not the same).
These considerations and some of the uses below are discussed in the NREL article “Grid-Scale Battery Storage – Frequently Asked Questions“. This article also discusses siting a grid battery in one of the following locations:-
The quantity of these services required increases as grids transition to renewables. Thus the cheaper batteries installed later will be able to tap into these revenue streams. They incllude :-
In most grids, these services are provided by active rotating fossil fuel or hydro generation at present. As a grid transitions to renewables, there will be more and more times when it requires generation from fossil fuels solely to provide grid services, and not to provide energy. But, currently, grid operations may stipulate some minimum active fossil fuel generation to provide grid stability services, such as inertia, short circuit current, frequency response, or reactive power. It is costly to run fossil fuel generation if it is not simultaneously required to provide energy, especially at 2022 European gas prices.
Migrations to smart grid technologies can remove the requirement for rotating fossil fuel generation to be active, solely to provide grid stability services, when the energy from it is not required. Grid batteries can provide some of these services, but total demand limits the required quantity of grid services. Revenue from these services will be a significant part of the total revenue of grid batteries installed over the next few years. But this grid services revenue will be a much smaller fraction of the total revenue required by the much higher battery storage capacity to be installed nearer 2030. By 2030, most grids will have completed the migration to such smart grid services provision.
As an example, around the two UK public holidays in May 2020, as a result of coronavirus lockdowns, UK electricity demand was very low. The UK grid had to curtail wind and nuclear output to make way for active gas generation on the UK grid to keep it stable. The UK National Grid ESO (Electricity System Operator) already had a plan of projects to remove the need for active gas generation purely for grid stability (when the energy from gas wasn’t required on the grid). By 2025 the aim of the stream of grid services projects is to allow the UK grid to be powered entirely by wind and solar, with or without active nuclear, whenever demand is low enough that energy from gas is not needed. However, prior to the coronavirus pandemic, no one had seriously imagined that wind, solar and nuclear output alone might be sufficient to provide enough power to meet all UK demand. So the UK grid was not ready, and wind and nuclear had to kicked off the grid, but still paid for, to make room within the electricity supply for gas whose energy was not strictly required!
Grid batteries installed in the UK by 2025 will be able to contract for most of these grid services. But these services requirements only grow with increasing demand, so later battery installations mostly won’t be able to tap into these revenue streams.
These services include:-
This section presents a rationale for determining how much grid battery storage is likely to be required to support worldwide grids in 2050.
The estimate of 2050 requirements depends on the assumptions made. These estimates should thus be taken as an indication only. They are not definitive.
On a simple basis, solar power is likely to be the predominant and cheapest form of power generation by 2050. The UABIO estimate for solar power [from the chart] (both direct and via storage) in 2050 is 23 PWh/year. Divide by 8,760 hours per year to get average solar PV generation of 2.6 TW.
Assume that 40% of demand takes place at night, when the sun isn’t shining. If solar is to play its full part in meeting such nighttime demand, some of the power it generates during the day must be stored, to be used overnight. Thus the short duration grid storage requirement may be 2.6 TW \times 24 hours \times 40% = 24 TWh of battery storage. As terrain usually restricts pumped hydro storage capacity, it is likely that most of this 24 TWh of storage will be grid battery storage.
Two things will affect this storage requirement. Firstly, a lot of loads can be flexible – e.g. EV charging with a range of 300 mile and a 30 mile daily round trip commute giving days of flexibility; heat pumps and air conditioner systems with some hours of thermal storage and flexibility. Secondly, much of the other half of supply is likely to be provided by wind power, which will require additional smoothing storage for gaps of less than a day.
Thus the devil will be in the details, and the short duration storage estimate should be treated as indicative only. By the time the storage needs to be installed, a lot of the detailed characteristics of the flexible load and the non-solar generation will be known for individual grids, so the requirement will be much better defined.
Compare the estimate of 24 TWh of grid storage with the likely total EV vehicle storage required in 2050.
The OICA estimate of total vehicles in the world in 2015 was around 1.3 billion. If there are 2 billion electric vehicles by 2050 (and zero fossil fuel vehicles), with an average battery capacity of 75 kWh or more (which would be very low for trucks and buses), then the total EV battery storage would be at least 150 TWh, which is six times the short-duration grid battery estimate above.
For individual countries or regions, EV storage of eight times the grid battery storage seems to be a common estimated ratio, so the global calculation for all road vehicles is broadly in line, particularly if you increase it somewhat because buses and trucks will have much more storage per vehicle, albeit these are a small proportion of vehicles.
Making a further assumption that grid battery storage costs will be around $80/kWh (including inverters, environment and grid connections) in 2021 dollars, then the total spent on short duration grid batteries would be around $2tr.
Given that recent world fossil fuel expenditures were around $1.5 – $2 trillion per year, even if the 24 TWh estimate is a factor of 2 or 3 times too low, or the total grid battery storage cost per kWh is somewhat higher, the crudely estimated global cost of grid battery storage is not a show stopper.
By 2050 there will be an option to obtain replacement grid battery storage as ex-EV battery packs, at a cut down price. Battery packs from two or three years of scrapped vehicles would suffice, assuming an average EV lifetime of 16 years.
V2G (vehicle to grid) is another possibility. If the owners of one third of world electric vehicles allow their vehicle batteries to be cycled between 50% and 100%, by smart grids, via smart charging, V2G could provide the required effective 24 TWh of grid battery storage.
To ensure profitable operation of a grid battery a number of factors needs to be taken into consideration. These include:-
According to the World Energy Council, Five Steps to Energy Storage report [p9], lithium ion grid storage batteries are typically 85 to 95% efficient. That means that the AC electrical energy out when discharging is 85 to 95% of the AC electrical energy input during charging.
For instance, according to the configurator, the new, 3.9 MWh, Tesla Megapacks have 93.5% and 92% AC round trip efficiency for the 4 and 2 hour configurations respectively. The datasheet for the older, 3 MWh, Tesla Megapacks claimed a round trip efficiency of 90.5% or 87% respectively.
As another example, the DC round trip efficiency is 95% for the Powin battery Stack360E, using CATL CB310 LFP battery cells. The efficiency figure includes fans, but no inverter or grid connection losses.
See the Efficiency section of the Battery Theory section of this web site for information on how battery efficiency can vary with battery usage.
A charging rate of 1C represents charging a battery from empty to full in 1 hour, and a higher rate represents faster charging. So 2C would be charging from empty to full in half an hour. The same measure applies to discharge rates.
For highest battery electrical efficiency, batteries should be charged and discharged as slowly as possible, and restricted to a maximum charge which would depend on the battery technology, such as 80% for NMC batteries. However, charge/discharge efficiency is not necessarily the most important operational factor at any point in time.
Most new grid batteries now tend to have a duration of 2 hours, 4 hours or more, for which the charging rates (assuming the same as the maximum discharge rates) are thus 0.5C, 0.25C or lower. Losses (and heating during charge and discharge) are thus proportionately lower than for mobile phone or battery electric cars which are routinely fast charged in less than an hour. Thus there should be a higher round trip efficiency for grid batteries compared to the same battery technology used in mobile phones and BEVs.
Grid battery storage of a few hours does not place huge demands on battery cells. The charge and discharge rates are a fraction of 1C, leading to both higher efficiency and less heat generation that other battery uses such as in mobile phones or during frequent fast charging of EV batteries. Such low charge and discharge rates lead to a long battery lifetime.
The specification of the Powin battery Stack360E, using CATL CB310 LFP battery cells gives an example of the possible lifetime of stationary battery storage. The specification says that the lifetime is 7,300 full cycles at the rate of 1 cycle per day over 20 years. The end of lifetime is defined as the time when the available capacity reduces to 66.6% of the original capacity. Other cell types have a similar 20 year lifetime, but for less than 1 cycle per day.
[Updated December 2024]
A Rho Motion report [paywalled] stated that Q3 2024 BESS system level prices in China had dropped to $82/kWh, with some cell prices dropping to $40-45/kWh, though more typically $55/kWh.
PowerChina received 76 bids in December 2024 for 16 GWh of BESS systems, at an average price of $66.30/kWh.
A more typical BESS price outside China would have been $250/kWh.
According to CNESA, as of the end of September 2024, China had roughly 53 GW / 120 GWh of lithium ion BESS capacity installed. China also has a similar quantity of pumped hydro storage installed.
China also has huge hydro capacity supplying 15% of Chinese grid generation.
A demonstration 5 MW/10 MWh New Energy (grid) Storage battery using sodium ion cells from Great Power (a Chinese company) is planned within the Qingdao North Coast Data Centre.
[Updated December 2024]
According to BESS analytics (link updated continuously), as of December 2024, the UK currently has 5 GW / 7 GWh of grid battery storage installed, and 6 GW / 12 GWh under construction, with a total grid battery storage pipeline of 9 GW / 18 GWh.
[Updated April 2026]
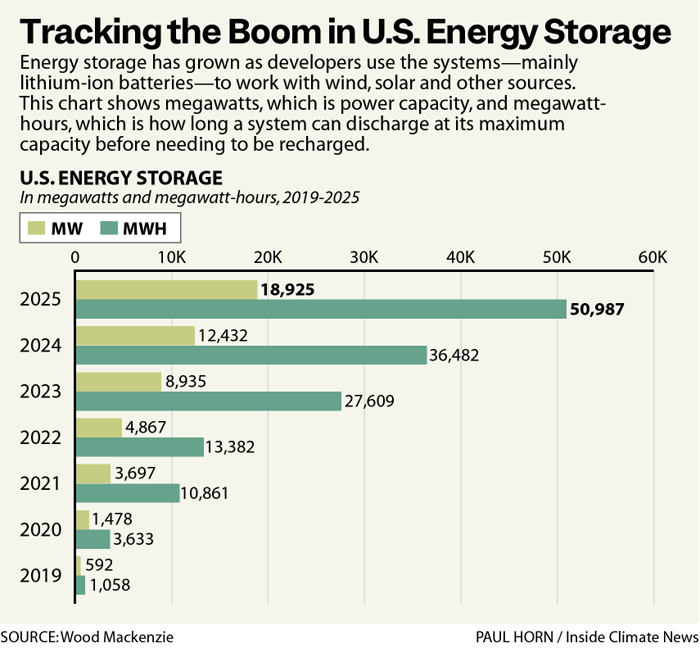
According to the February 2026 spreadsheet from the EIA Electric Generator Inventory spreadsheet list, the USA had 44 GW of grid batteries installed. Download the spreadsheet, enable editing, autofilter, click on “Technology” and select “Batteries”.
The US states with the most solar power are California and Texas. It should thus be no surprise that these states also have the most utility grid battery storage. Texas overtook California in February 2026 in having more GW of utility scale grid battery storage. However, California’s grid batteries have twice the duration, so retains the crown in total GWh available. See the tabs for USA-CA and USA-TX for further details.
The challenge between Texas and California to be the battery storage (and solar) top dog is on!
[Updated April 2026]
On Sunday 27th March 2026 at 7 pm, 43% of California’s electricity supply was coming from batteries, twice as much as the next largest source, which was gas plants.
However, Texas has now just overtaken California in terms of the power of utility grid batteries installed, with 15.0 GW for TX compared with 14.4 GW for CA, with Arizona in third with 5.0 GW.
But California is still king in terms of utility scale storage capacity, with 48.4 GWh (3.4 hours) vs 22.8 GWh (1.5 hours) for TX.
The Texas lead in grid battery storage power follows from Texas taking the lead over California in generation from utility scale solar, with 58.6 TWh vs California’s 53.7 TWh in 2025. However, California retains the overall lead once smaller-scale solar is included, with a total of 88 TWh of generation compared to 63 TWh for Texas.
[Updated April 2026]
Texas has now overtaken California in terms of the power of utility grid batteries installed, with 15.0 GW for TX compared with 14.4 GW for CA, with Arizona in third with 5.0 GW.
But California is still king in terms of utility scale storage capacity, with 48.4 GWh (3.4 hours) vs 22.8 GWh (1.5 hours) for TX.
The Texas lead in grid battery storage power follows from Texas taking the lead over California in generation from utility scale solar, with 58.6 TWh vs California’s 53.7 TWh in 2025. However, California retains the overall lead once smaller-scale solar is included, with a total of 88 TWh of generation compared to 63 TWh for Texas.