Solar PV
Solar PV
Serpa Solar Power Plant Portugal – image by Ceinturion (CC BY-SA 3.0)
Table of Contents
General
According to BNEF, 268 GW (DC) of solar PV capacity was installed in 2022, with an expectation of another 315 GW to be installed in 2023. Adding these to the IEA figure for 2021 cumulative installation of 884 GW means there was 1,152 GW (1.15 TW) of solar PV (photovoltaic) capacity installed world wide at the end of 2022.

In its report, the IEA says the 2021 split in installed solar PV capacity is 56% utility scale, 27% commercial and industrial and 16% residential.
Here is an estimate of solar PV growth from the November 2019 IRENA document “Future of solar PV” [page 22].
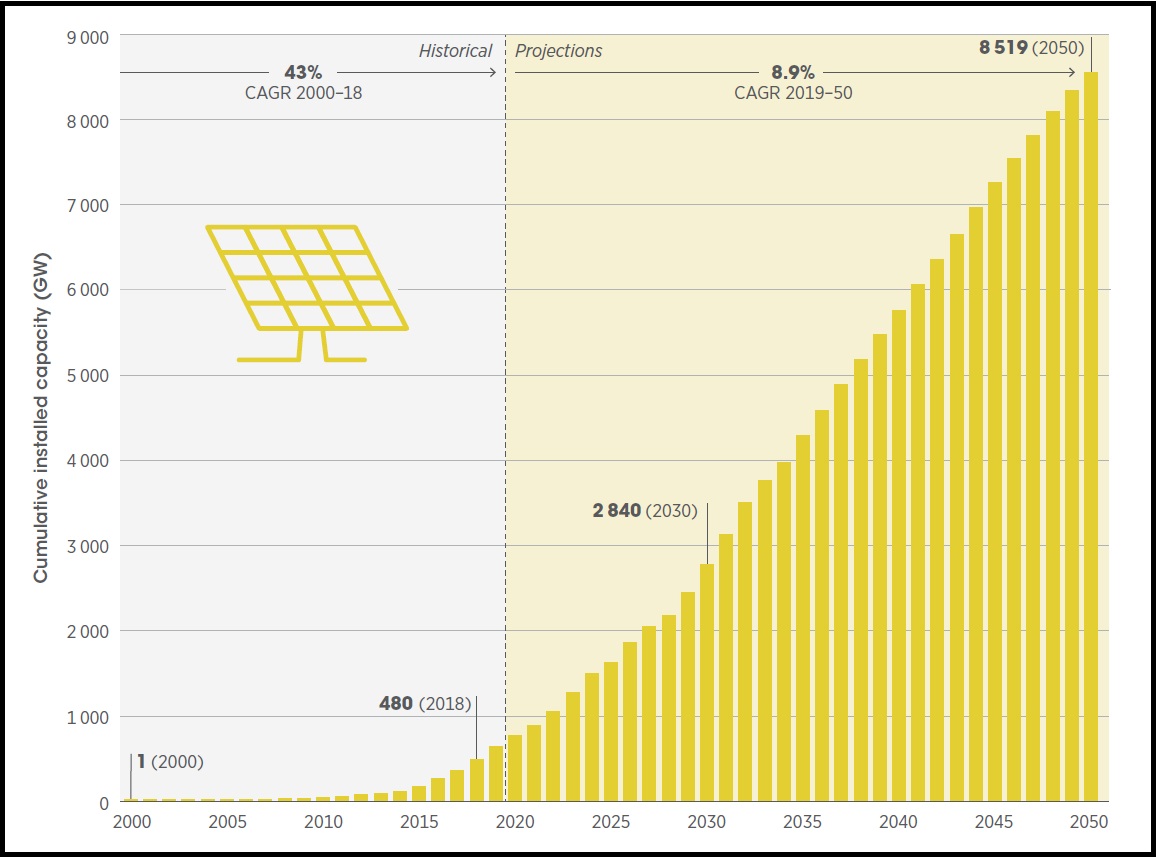
IRENA assumes that solar PV installation does not exhibit any more exponential growth after 2024. After 2024 the IRENA assumption is straight line growth (same quantity installed each year).
Between 2031 and 2041, IRENA sees installation of only 3 TW of solar PV, or 300 GW per year. Assuming utility-scale with prices down to, say, $600/kW, the annual cost would be around $180 billion per year spent on solar PV, compared to around $2.5 tr per year currently spent on oil. $2.5 tr is for the purchase of 100 million barrels of oil per day at $70/barrel. To spend only 7% of this on solar power to supply 40-50% of global energy by 2050 is surely highly cost effective.
Let us use a second way to work out the likely requirement for solar PV to be installed by 2050.
Solar PV power is likely to be cheaper than wind power by 2050, and both will be cheaper than any other form of energy at that point. So a reasonable assumption is that solar PV power will contribute at least half of the world’s energy by 2050.
Typically, if fossil fuel energy applications are electrified, the total energy required comes down by a factor of 3. In the case of the UK it would be expected that 100% electrification of everything (at least as some part of the fuel supply chain, e.g. to produce hydrogen via electrolysis) would at least double the electricity demand. However, many developing countries will expand total energy use hugely, perhaps by a factor of 3, by 2050. Most likely we will require between 4 and 5 times the current global electricity grid capacity by 2050.
Current electricity demand is 25,000 TWh/year, so 2050 electricity demand is likely to be in the range of 100,000 to 125,000 TWh/year, an average of 11 to 14 TW. Solar PV could supply half, an average of 5.5 to 7 TW of generation. If the solar PV CF (capacity factor) is 17%, the world required 32 to 41 TW of solar PV capacity in 2050, four times what IRENA is suggesting above.
And a third way…
The UABIO estimate for solar power [from the chart] (both direct and via storage) in 2050 is 23 PWh/year. Divide by 8,760 hours per year to get average solar PV generation of 2.6 TW. Assuming the IRENA utility solar PV average capacity factor for 2021 [p79,p91] of 17.2%, the world would need 15 TW of solar PV capacity. 15 TW of solar PV capacity is lower than the second estimate derived above, but still nearly twice IRENA’s suggested figure of 8.5 TW.
The conclusion is that the IRENA prediction of solar PV growth by year is likely too low by a factor of two or more.
Technology
There is an excellent summary of the most recent solar PV technology trends on pages 49-59 of the May 2022 Solar Power Europe Global Market Outlook report.
Solar cell materials
Most solar panel modules are C-Si (crystalline silicon) with a transition under way from multi-crystalline to single crystal technology which brings a higher efficiency.
Mounting
In the sunniest places utility scale solar panels generally have single axis solar tracking (e.g. always facing south, rotating up and down to match the angle of the sun). On rooftops, and in less sunny places, where sunlight is more diffuse, solar panels are typically fixed. They are mounted facing south, at the same angle to the vertical as the latitude. Thus, at the equator (latitude 0\degree) panels would point vertically upwards.
Efficiency
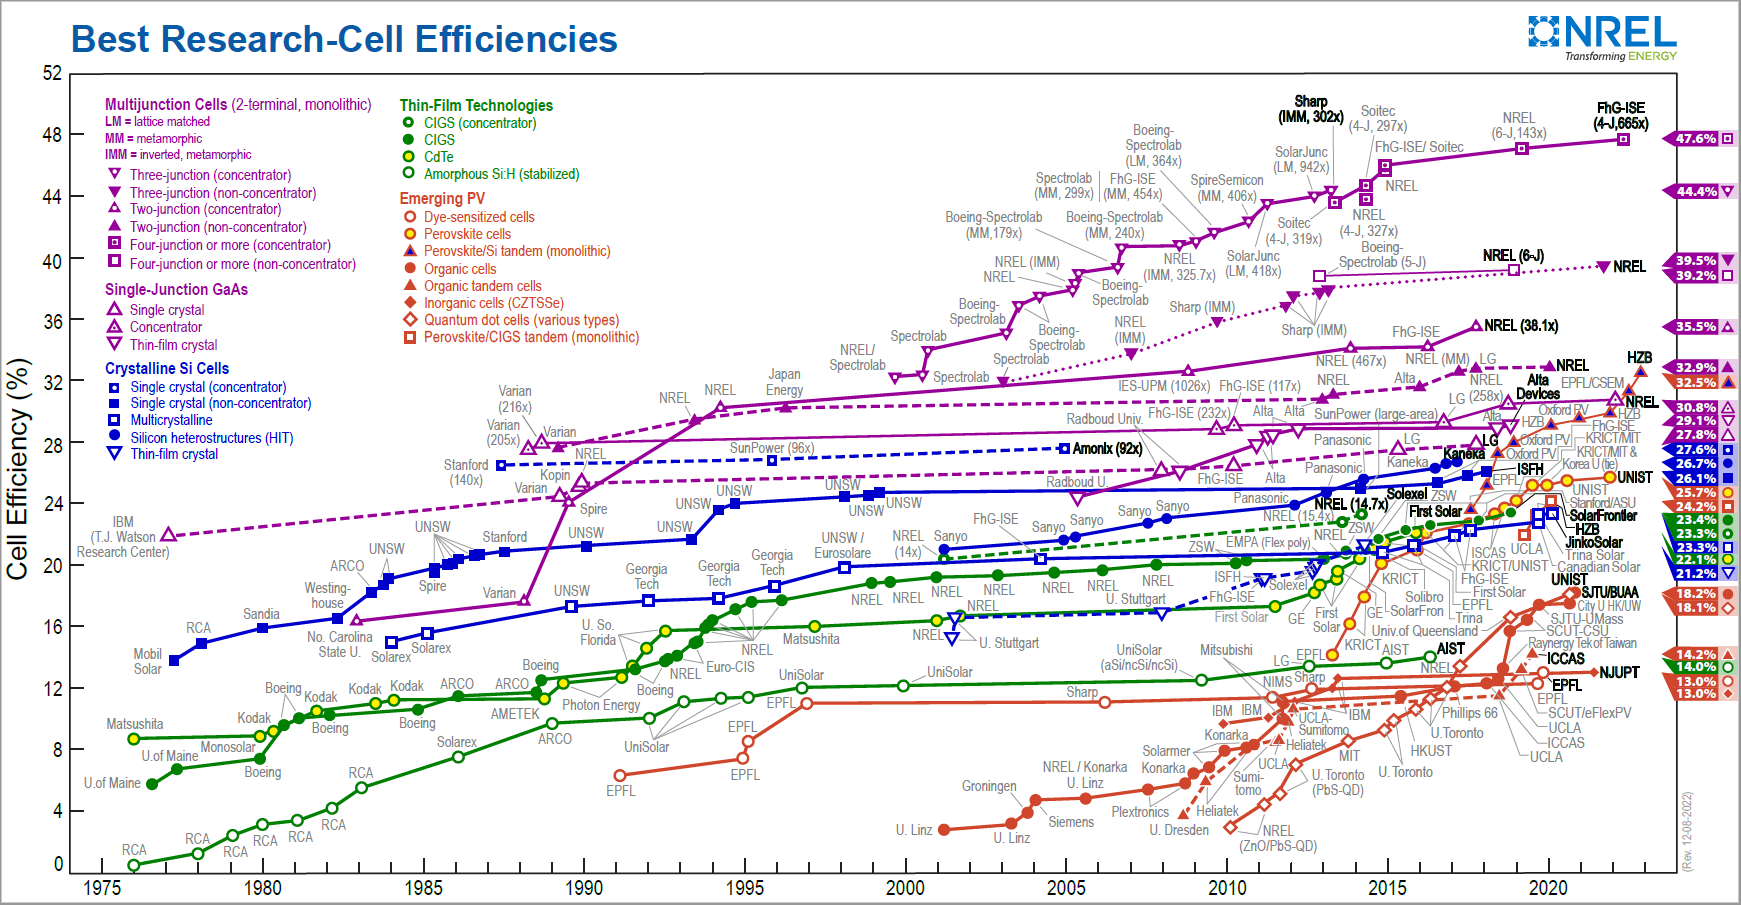
NREL (the US National Renewable Energy Laboratory) keeps an updated chart of photovoltaic solar cell efficiencies by type and year. Here is the version from early January 2023.
Click on the chart for the most recent, interactive version.
In practice, 90% of solar panels use silicon solar cells, of which 95% are C-Si (crystalline silicon) solar cells, with maximum efficiencies between 21% for thin film and 26% likely practical maximum for C-Si single junction solar cells.
The most promising mass-market technique for improving efficiency would be to use tandem, perovskite plus C-Si (dual junction), solar cells. The perovskite junction can be deposited on top of the base silicon solar cells using straightforward, low cost, techniques. As of October 2023, Longi holds the record for a perovskite/silicon tandem solar cell at 33.9% efficiency.
Multi-junction solar cells can be much more efficient – up to a record 47.6% – but are much more expensive. The highest efficiencies can only be obtain with concentrated sunlight (e.g. 200 suns), which requires two axis tracking, and a bigger land area, both of which increase the overall cost.
In space, where weight adds to the launch cost, multi-junction solar cells with no concentration are well worthwhile. On the ground, they are too expensive. For a given electricity production, it is generally much cheaper to use less efficient C-Si single junction technology installed over a larger land area.
Capacity factor
The AC capacity factor of a solar farm is normally quoted.
Capacity factors depend on whether the solar panels are fixed, or have 1 axis or 2 axis solar tracking.
The ILR (inverter loading ratio) is the ratio of the DC maximum solar panel output of an installation to the AC maximum output. The more solar panels there are, relative to the inverter and grid connection capacity, the higher the ILR will be. See the Solar PV theory page.
According to an IRENA 2021 solar report [p79], the average solar PV capacity factor for utility solar farms commissioning in 2021 was 17.2%
Capacity factors vary according to location. Solar irradiance at the surface is highest in the subtropics, rather than the tropics, which tend to be more cloudy.
Unit costs
According to IRENA, the installation capacity weighted global LCOE (levelised cost of electricity) of solar PV power in 2021 was $55/MWh [p16-19], a reduction of 13% compared to 2020.
Solar PV module costs have reduced by 99.6% since 1976, which is responsible for most of the price reduction in solar power. Costs have closely followed the law of learning curves (strictly, but rarely, called Wright’s law) – that the price of some technology shows the same reduction for each doubling of installed capacity.

The IRENA 2021 solar PV cost report [p79] gives the average 2021 cost of utility solar PV as $857/kW, an average 2021 capacity factor of 17.2%, and an average 2021 LCOE of $48/MWh.

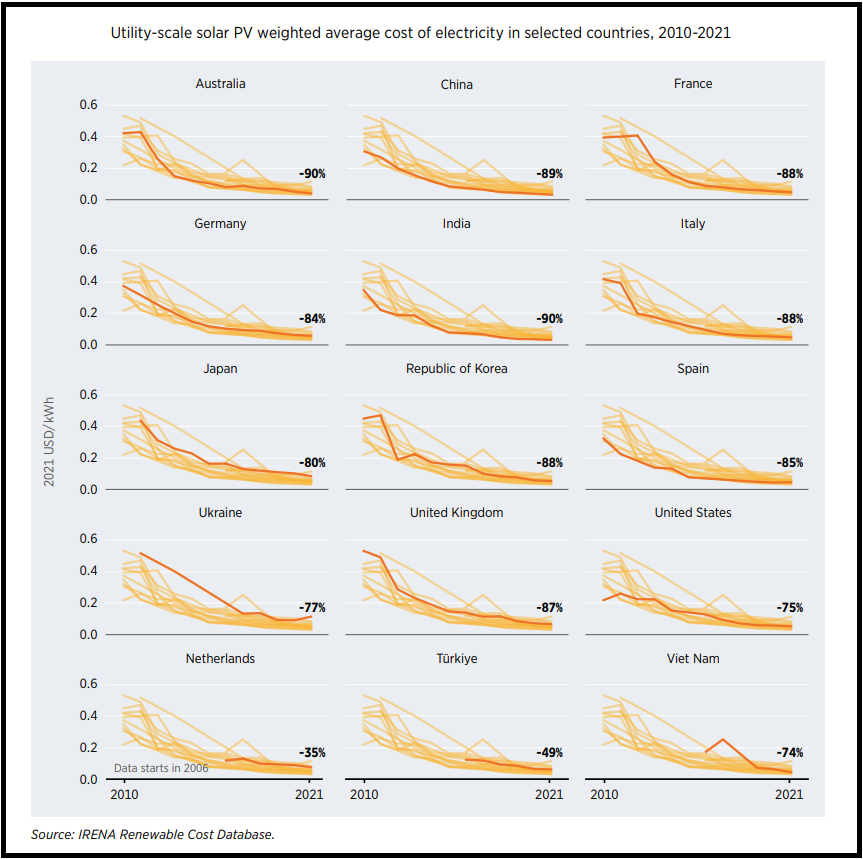
The same IRENA 2021 solar PV report [p98] gives the LCOE reductions 2010 to 2021 for selected countries.
2050 total solar PV costs
In the General section above, the conclusion was that 15-32 TW of solar PV was likely to be required to meet 2050 net zero requirements, assuming electrification of most energy use, with solar PV providing half of the total annual energy requirements.
The cost of oil in use currently is about $2.5tr per year, for 100 mbpd (million barrels per day), traded at $70 per barrel, as in the General section above. Assuming a capital cost of $600,000 per MW of solar PV capacity, the total cost of the solar PV would be $9-19 trillion, which seems large. However, spread over 25 of the 28 years remaining to 2050, it would represent $360bn to $770bn per year, or 14% to 30% of the current expenditure on oil each year. A utility solar farm should last 25 to 30 year.
After 25 years, the solar PV farms may require renewing, so the expenditure per year will repeat again over the following 25 years 2051 to 2075.
The cost has been estimated assuming all solar PV capacity installed is utility scale. Commercial and rooftop solar PV is more expensive than utility scale solar PV, even if governments mandate it and subsidise it.
In addition to the solar farms themselves, there is a need to match variable solar (and wind) generation to variable demand. A few hours of average load of grid battery storage can fill short duration gaps, and a long duration storage technology would provide backup for long duration gaps. Flexible loads and demand response can replace the need for some of the grid battery storage and backup capacity. These storage technologies also cost money, but the combination required to provide reliable electricity, for the energy applications which require it, appears to cost less than the current spending on oil, gas and coal.
Surface sunlight is strongest in the subtropics, not the tropics (which tend to be cloudy). See the Global Solar Atlas. Most of the cheapest solar PV bids are for projects in the subtropics.
It is difficult to relate bid prices below $20/MWh to a representative commercial LCOE for the projects, or to compare the projects against each other. The solar project bid price depends on what the grid operator or government supplies to the projects (e.g. the grid connection might not be the responsibility of the project), whether low cost loans or loan guarantees are available, and the charges for land leases. Projects with a long delivery timescale can forward price the cost of some components such as solar panels, mountings or inverters, and assume the usual price decreases over time. In the USA and elsewhere, tax subsidies are available which can be claimed directly by the project.
The negative bid, at the top of the list below, contains another example – the grid provides a grid connection for 30 years while the contract for negatively priced solar power only runs for 15 years. And the grid connection can be used to transmit other power to the grid whenever the contracted solar generation does not take the full capacity.
The list below includes only the lowest bid to each region, except for Portugal where the lowest bid is negative.
- -$4.39/MWh (i.e. negative) 100 MW floating solar, Alqueva Dam – Portugal, April 2022*
- $10.4/MWh 600 MW Al Shuaiba PV farm – Saudi Arabia, April 2021
- $13.16/MWh – Portugal, August 2020
- $13.32/MWh timed blocks of power – Chile, September 2021
- $13.50/MWh 2 GW Al Dhafra – Abu Dhabi, June 2020
- $15.00/MWh 100 MW Hecate, Sant Teresa – New Mexico, May 2020
- $15.67/MWh 800 MW Al-Kharsaah, Doha – Qatar, January 2020
- $16.9/MWh 900 MW 5th phase of MBR Solar Park – Dubai, October 2019
- $17.50/MWh 211 MW A4 renewables auction for 5 projects – Brazil, June 2019
Solar PV production region
As can be seen, China is responsible for the production of most solar PV modules and the sub-structures and materials which go into them. China is also the biggest single market for solar PV panels in the worlds, but is less than 40% of the global PV market.
Materials
According to IRENA’s 2017 document “Renewable energy benefits: leveraging local capacity for solar PV” [Fig 5 p13], the materials used for a 1 MW utility scale solar PV farm are roughly as follows:-
If the average capacity factor was the global average of 17%, then in its expected 25 year life, the 1 MW solar farm would generate 37 GWh of electricity.
Comparing with generation of the same quantity of electricity by other means, it would displace 37,000 tons of CO2 compared with a coal generation plant (1 tonne CO2/MWh), and 18,500 tonnes of CO2 compared with a gas generation plant (500 kg CO2/MWh).
CO2 emissions from the manufacture of the solar panels are 420 (Germany) to 750 (China) tonnes/MW, far less than the savings of tens of thousands of tonnes of CO2, and representing a reduction of 80% over recent years.
Production CO2 emissions to produce one tonne of various materials are:-
- steel – 1.8 tonnes
- concrete – 730 to 990 kg
- copper – 4 to 4.2 tonnes
- aluminium – some included in solar panels figures, otherwise 17* tonnes!!
- glass – included in solar panels figures
- silicon – included in solar panels figures
*According to the IEA, the high CO2 emissions value for aluminium is due to expendable carbon anodes, which are oxidised to CO2 by the oxygen released during electrolysis. The use of inert anodes (not made from carbon) would avoid most of these emissions, but requires further development.
In 2023, based on the Chinese NEA 2023 power statistics, China’s additions of 217 GW of solar capacity were more than the rest of the world put together. (English version)
As of the end of 2023, China had 610 GW of solar PV capacity, after adding 217 GW in 2023.
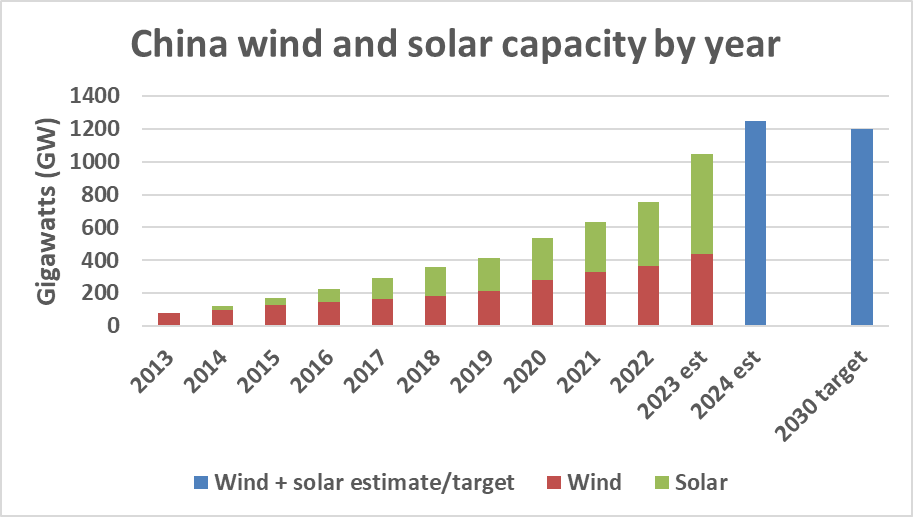
China’s 2023 combined wind and solar installations target was 160 GW, but the actual total installed in 2023 was 293 GW. The Chinese 2030 combined wind and solar target of 1,200 GW is thus too low. In 2024, China is almost certain to achieve its 2030 wind and solar combine capacity target, 6 years early – see chart.
China has a tendency to “under-promise and over-deliver” on climate targets. Also see here.
As indicated by previous solar targets, the likely outcome is that the 2030 wind+solar target, if reached six years earlier than promised, would then be doubled!!
Be careful of figures for China’s “renewable energy” capacity, because these will include the 390 GW of hydro capacity installed by the end of 2021, as well as wind and solar, so are not comparable with the chart above.

As can be seen from the chart ending in Q4 2021, in recent years China tends to commission much of its solar PV capacity additions at the end of the year, and often in December.
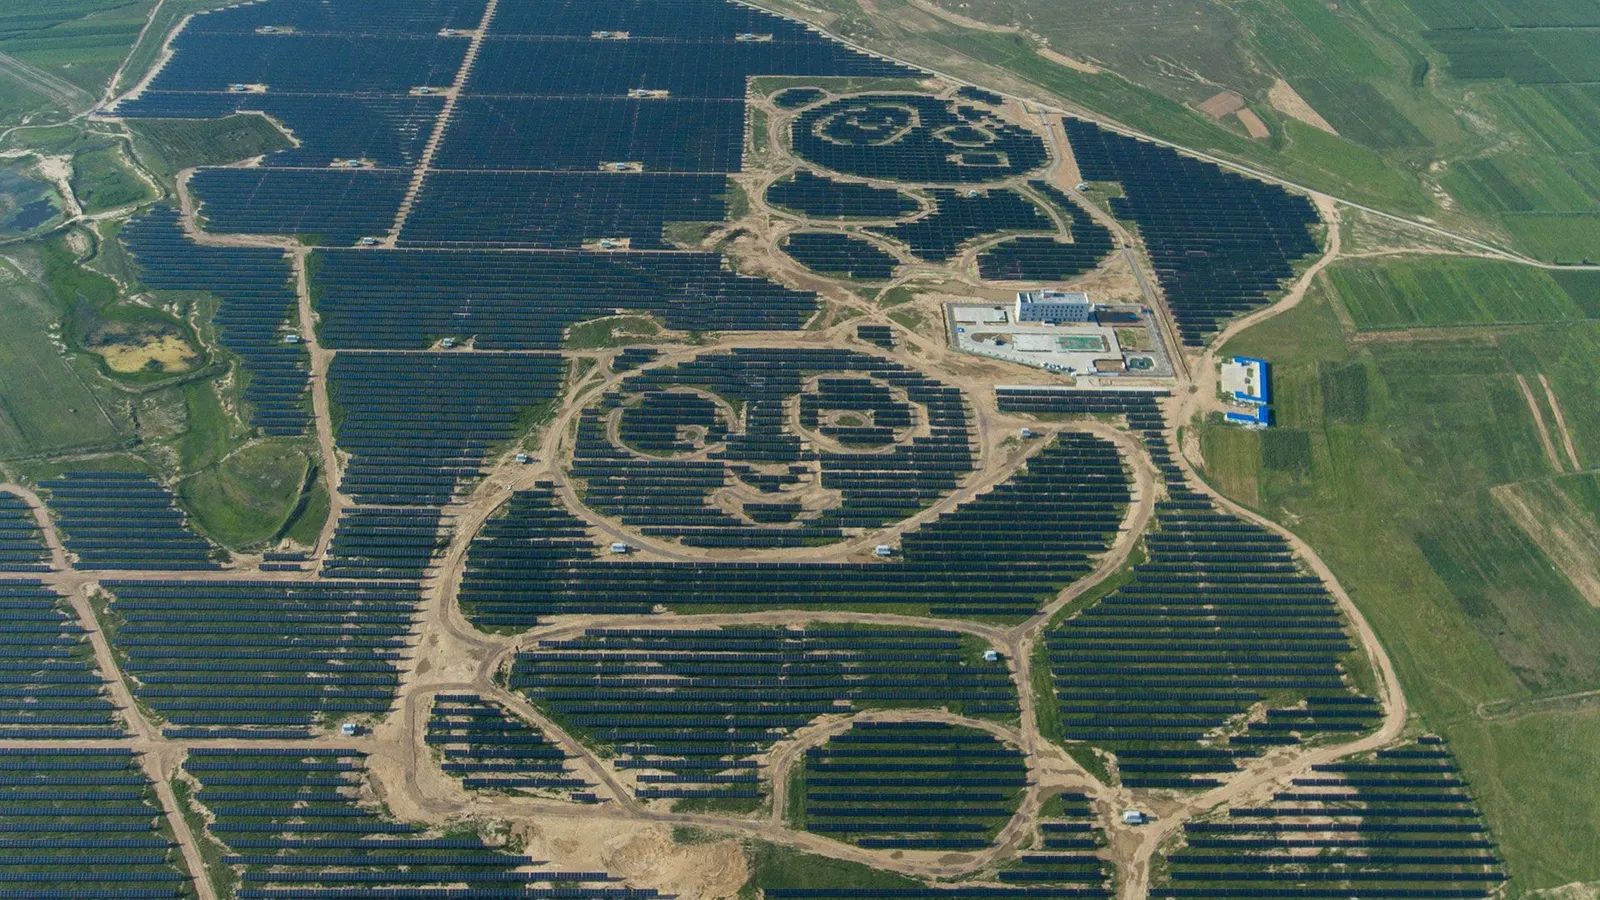
There is also some creativity in solar farm design from the Chinese:-
The image is from this BBC article.
According to SolarPower Europe, the EU had 209 GW of solar power capacity at the end of 2022, up 25% with the addition of 41.4 GW in 2022. Apparently that rise is the equivalent of natural gas imports of 4.5 bcm, used to generate power.
SolarPower Europe sees EU solar capacity reaching 484 GW by 2026, with 54 to 68 GW of that installed in 2023.
In 2022, the EMBER report for 2022 shows that the EU generated 203 TWh of solar power, which was 7.3% of all electricity supply. The following information and charts are also from the same EMBER report.
In 2022 Germany had the largest solar power generation in the EU.
In 2022, Luxembourg had the highest proportion of solar power supply with solar as 20% of supply, while the Netherlands was second and top among the larger countries of the EU.

Germany was an early adopter of solar PV from 2005, pushing solar PV power adoption to mass market levels with large initial subsidies. California is also regarded as an early adopter, but did not reach additions of around1 GW in a year until 2012 – 7 years later than Germany. Germany now has 65 GW of installed solar PV power, while California had only 38 GW at the end of Q3 2022.

German solar PV installations originally peaked a decade ago at 8.2 GW in 2012. But in 2022 Germany boosted solar additions to 7.9 GW.
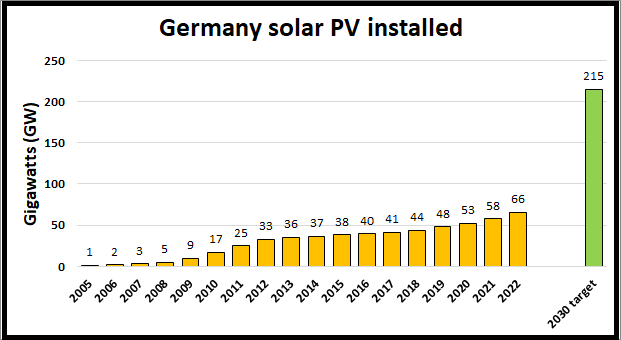
As part of 2022 amendments to 2000 Renewable Energy Act (EEG), Germany proposes a target of 215 GW of solar PV by 2030, which implies the addition of at least 22 GW per year from 2026. This is part of a target of 80% (600 TWh) of German grid power from renewables by 2030, and close to 100% green electricity by 2035.
In 2022, solar PV power in Germany produced 57.6 TWh, which is an average over the 8,760 hours in a year of 6.57 GW. From the same source, the solar PV capacity at the start and end of 2022 was 58.98 GW and 65.52 GW, which averages 62.75 GW. The capacity factor of solar PV power in Germany in 2022 was thus 10.5%.
Typically, solar PV capacity factor in Germany varies throughout the year between 3% in the depths of winter to 20% in the middle of summer. Note that German offshore wind capacity factors have the opposite distribution – highest in winter and lowest in summer. So German offshore wind and solar are broadly complementary, as demonstrated in a 2019 paper by Kaspar et al.
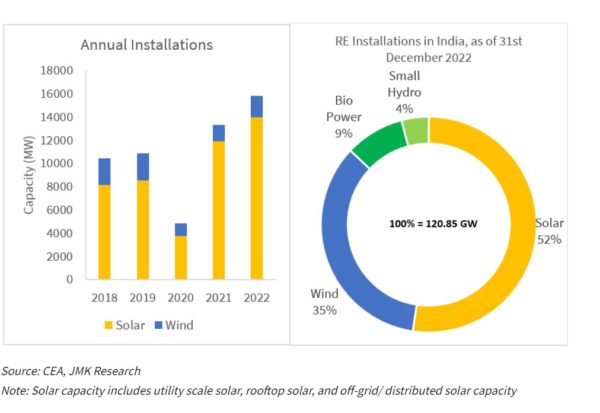
India is the world’s third largest producer of renewable energy, with 40% of its installed electricity capacity coming from non-fossil fuel sources.
India had 56 GW of installed solar PV capacity at the end of 2022. However, according to Mercom, the original target from 2017 was for 100 GW of solar capacity by the end of 2022. The link to Mercom outlines some of the factors resulting in this target being missed, and covers similar misses in India’s 2022 target for wind power and renewables in general.
India has a net zero CO2 emissions target date of 2070. The Indian railways have a net zero emissions target date of 2030.
The 2030 target is for 500 GW of renewables, to supply half of India’s electricity.
As of the end of 2022, the UK had 13.4 GW of solar PV capacity [see p14] installed. In 2022, this produced an average output power of 1.29 GW, giving an annual capacity factor of 9.6%.
The UK solar PV capacity factor is very seasonal. In the summer June to August 2022 it was 15.6%, but in the winter December 2021 to February 2022 it was 3.4%. This is highly complementary on a seasonal basis to the UK wind power capacity factor, which is considerably higher in winter than in summer.
The UK 2021/22 CfD (contract for differences) allocation round 4 auction (see Table (E) p8) has resulted in a further 2.2 GW of solar PV capacity to be installed, mainly in the UK financial year 2024/2025, at a strike price of £46/MWh in 2012 pounds, which is £59/MWh in January 2022 pounds.
After the December 2015 General Election, the Conservative government, headed by prime minister David Cameron, changed planning guidance and withdrew subsidies from uncontracted solar PV farms in England. This resulted in almost no new solar PV and onshore wind installations in England since that date, though developments in Scotland continued, as this area of responsibility is devolved to the Scottish government. English solar and onshore wind farms were no longer allowed to participate in CfD auctions.
The restriction on English solar PV was relaxed for the CfD allocation round 4 auction in 2021/22, for solar farms of less than 50 MW. 2.2 GW was contracted for installation 2023 to 2025.
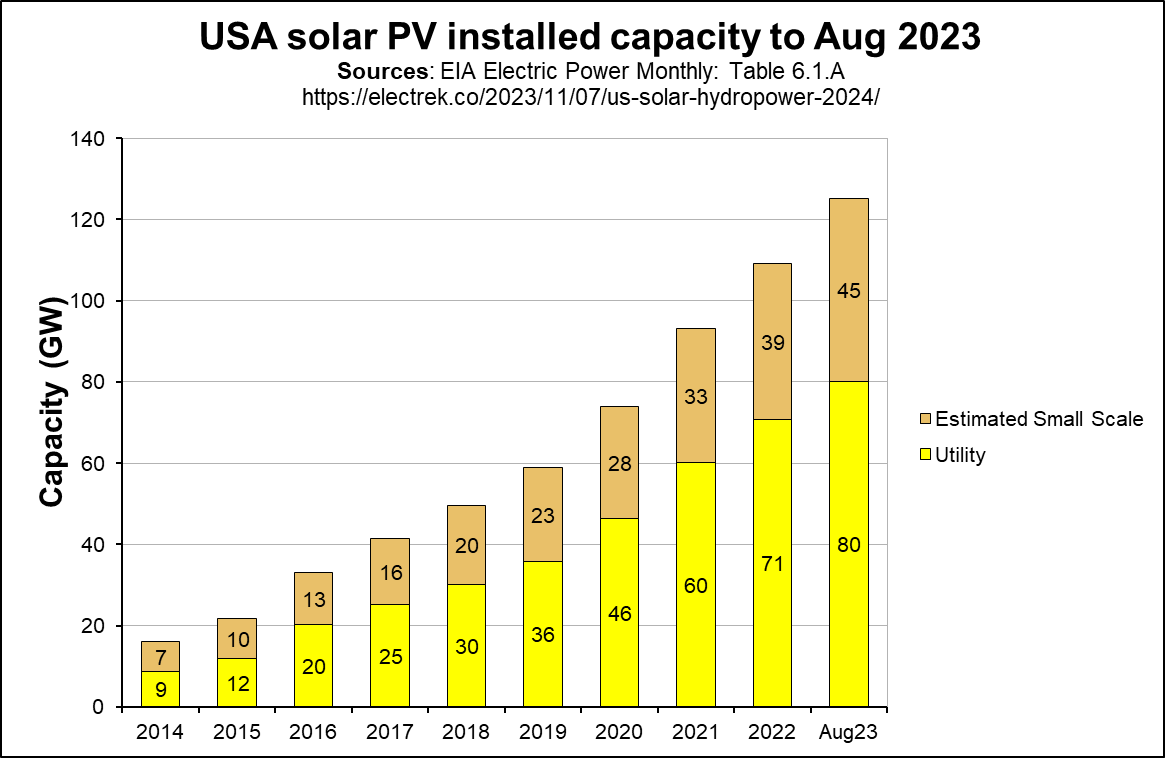
The capacity of solar PV installed in the USA has been growing steadily.
Data is from the EIA Electric Power Monthly, Table 6.1.A. “Estimated Net Summer Solar Photovoltaic Capacity From Utility and Small Scale Facilities” updated with 2023 data to August from Electrek November 2023 “In a first, US solar will generate more electricity than hydropower in 2024“.
The 2022 US Inflation Reduction Act contains provisions to subsidise green technologies to accelerate uptake.
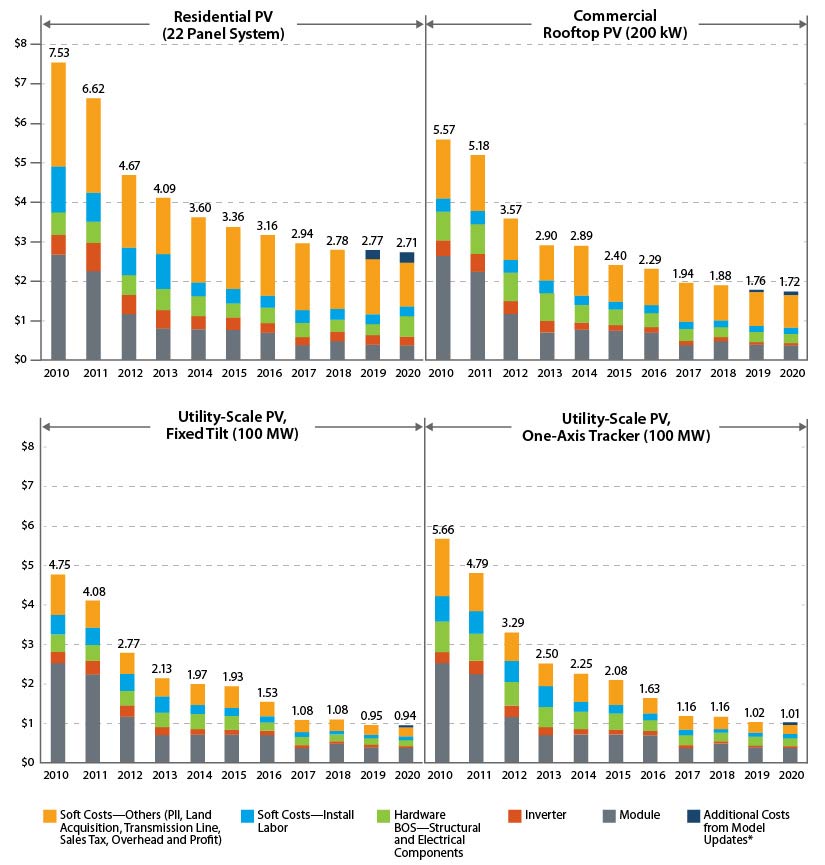
USA utility scale capital costs reduced by 85% from 2010 to 2020.
[Updated December 2023]\
In the US, California has the most solar PV capacity. At the end of Q3 2023, California had 43 GW of solar installed, which include a little solar CSP thermal (concentrated solar power). At present, solar power provides 28% of California’s electricity.
The SEIA (Solar Energy Industries Association) web page for California includes the diagram below, of the annual growth of solar power in California:-
SEIA estimates that California will install another 27 GW by the end of 2026, which would bring the total to 65 GW.
California duck curve
California is experiencing (and starting to resolve) the issues of duck curve and large solar penetration into grid generation before anyone else. But these issues (and their solutions) are likely to be commonplace before too long in many other sunny places, as solar penetration rises to approach 20% of grid supply.
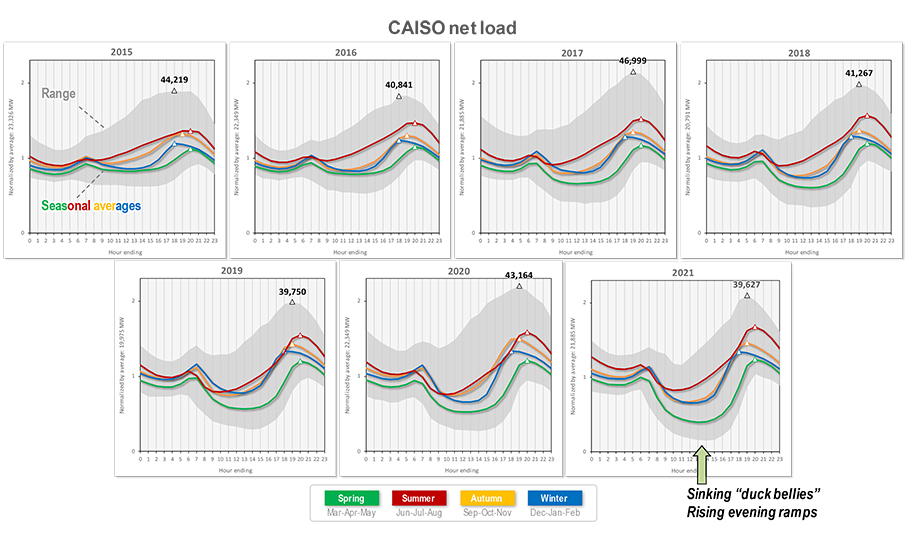
Californian solar has shifted the distribution of net load (total demand minus solar generation) throughout the daytime hours. There is an excellent CAISO (Californian Independent System Operator) blog explaining the problem in detail. The series of diagrams below shows load by hour of day, demonstrating the issue:-
Instead of having a relative flat daytime load with a peak in the early evening, California solar power reduces net demand during the day, leading to a much steeper ramp in demand as soon as the sun goes down.
Air conditioning creates a lot of Californian electricity demand, and peaks in summer. Even though solar PV generation also peaks in summer, the summer net load is still the highest of the four seasons. Surprisingly, the lowest daytime net load is in spring.
In 2022 California curtailed 2.4 TWh of wind and solar power, of which 2/3rds was during March to May.
A good solution for both curtailment and the steep evening ramp at dusk is to install 4 hours of grid batteries, either standalone, or integrated with new solar PV installations. By the end of 2023, California grid storage is expected to be 8.5 GW, likely of 2 to 4 hours duration. By 2025, grid batteries could prevent up to 12 GWh a day of renewable power curtailment.
[Updated December 2023]
By the end of Q3 2023, Texas had the second highest capacity of solar PV, with 20 GW of solar PV installed. At present, solar power provides 5.5% of Texas’ electricity. At that time, California had 43 GW of solar PV capacity providing 28% of Californian electricity, but solar in Texas is growing much faster.
The SEIA (Solar Energy Industries Association) web page for Texas includes this diagram of the annual growth of solar power in Texas:-
The Texas state projection is for 54 GW of solar capacity installed by the end of 2027 (based on 14 GW installed by the end of 2022).
However, the EIA estimates Texas will have solar capacity of only 43 GW installed in 2035, causing high levels of curtailment if other aspects of the ERCOT grid do not change to accommodate it. However, at rates of addition of 4-6 GW per year over 2021 through 2023, this estimate seems very low.
54 GW of solar could provide up to 15% of Texas electricity supply, depending on the growth in demand. And at that installation rate, by 2030, Texas may overtake California as the US state with the highest installed solar PV capacity.
By the end of 2021, the Texas overall grid generation was almost twice as large as that of California, at 482 TWh vs 278 TWh annual supply. This should lead naturally to a higher installed solar PV capacity.
